Zip Codes with the Highest Percentage of Population Employed in Finance & Insurance in Acton, MA
RELATED REPORTS & OPTIONS
Finance & Insurance
Acton
Compare Zip Codes
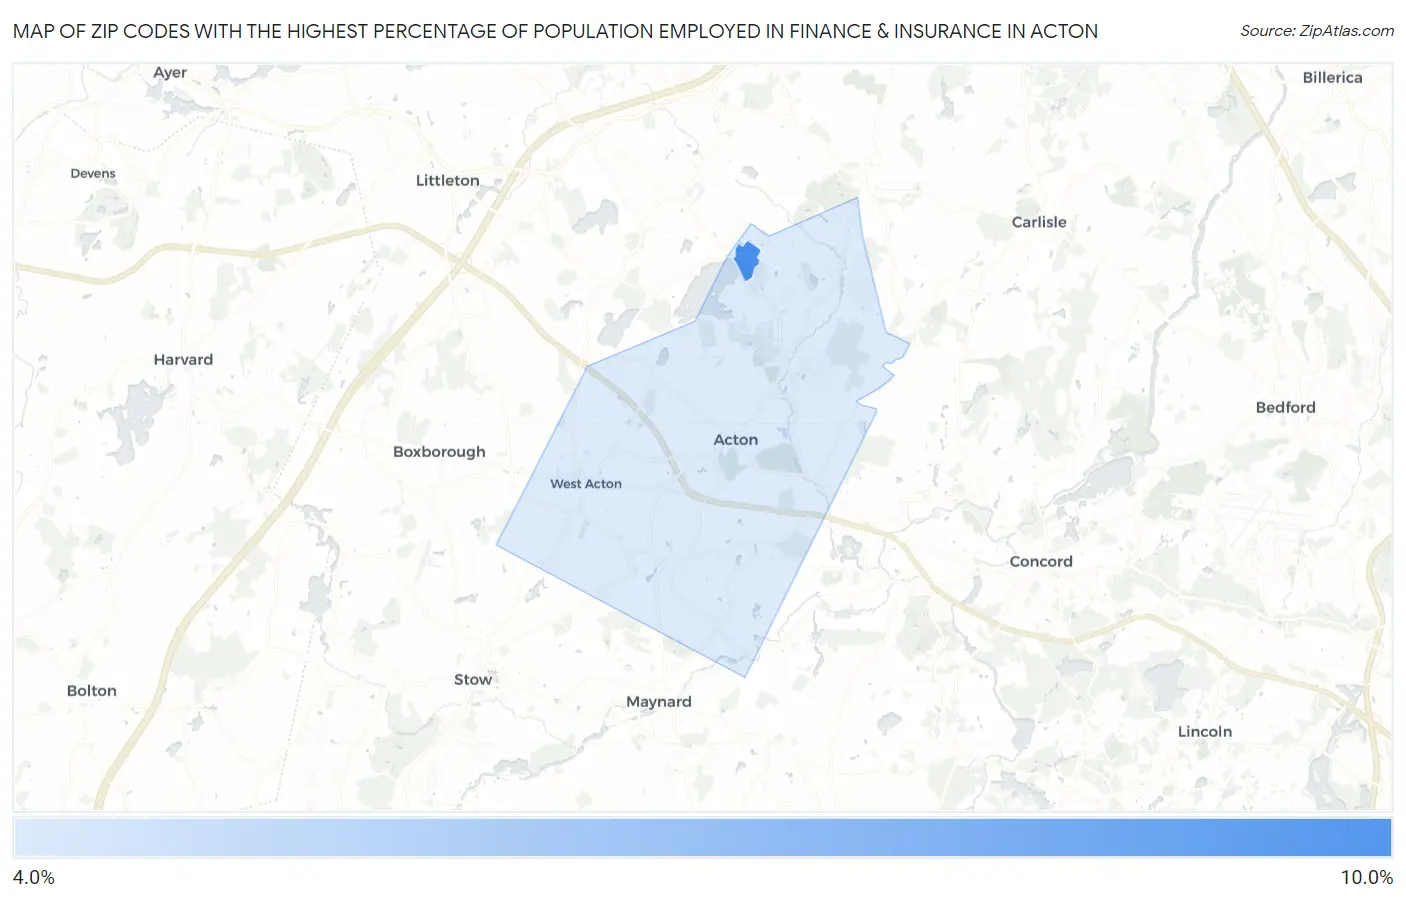
Map of Zip Codes with the Highest Percentage of Population Employed in Finance & Insurance in Acton
4.7%
9.6%
Zip Codes with the Highest Percentage of Population Employed in Finance & Insurance in Acton, MA
| Zip Code | % Employed | vs State | vs National | |
| 1. | 01718 | 9.6% | 5.6%(+3.94)#61 | 4.8%(+4.79)#1,937 |
| 2. | 01720 | 4.7% | 5.6%(-0.895)#247 | 4.8%(-0.045)#9,149 |
1
Common Questions
What are the Top Zip Codes with the Highest Percentage of Population Employed in Finance & Insurance in Acton, MA?
Top Zip Codes with the Highest Percentage of Population Employed in Finance & Insurance in Acton, MA are:
What zip code has the Highest Percentage of Population Employed in Finance & Insurance in Acton, MA?
01718 has the Highest Percentage of Population Employed in Finance & Insurance in Acton, MA with 9.6%.
What is the Percentage of Population Employed in Finance & Insurance in Massachusetts?
Percentage of Population Employed in Finance & Insurance in Massachusetts is 5.6%.
What is the Percentage of Population Employed in Finance & Insurance in the United States?
Percentage of Population Employed in Finance & Insurance in the United States is 4.8%.