Immigrants from Kazakhstan vs Welsh In Labor Force | Age > 16
COMPARE
Immigrants from Kazakhstan
Welsh
In Labor Force | Age > 16
In Labor Force | Age > 16 Comparison
Immigrants from Kazakhstan
Welsh
65.3%
IN LABOR FORCE | AGE > 16
68.1/ 100
METRIC RATING
165th/ 347
METRIC RANK
64.0%
IN LABOR FORCE | AGE > 16
0.2/ 100
METRIC RATING
279th/ 347
METRIC RANK
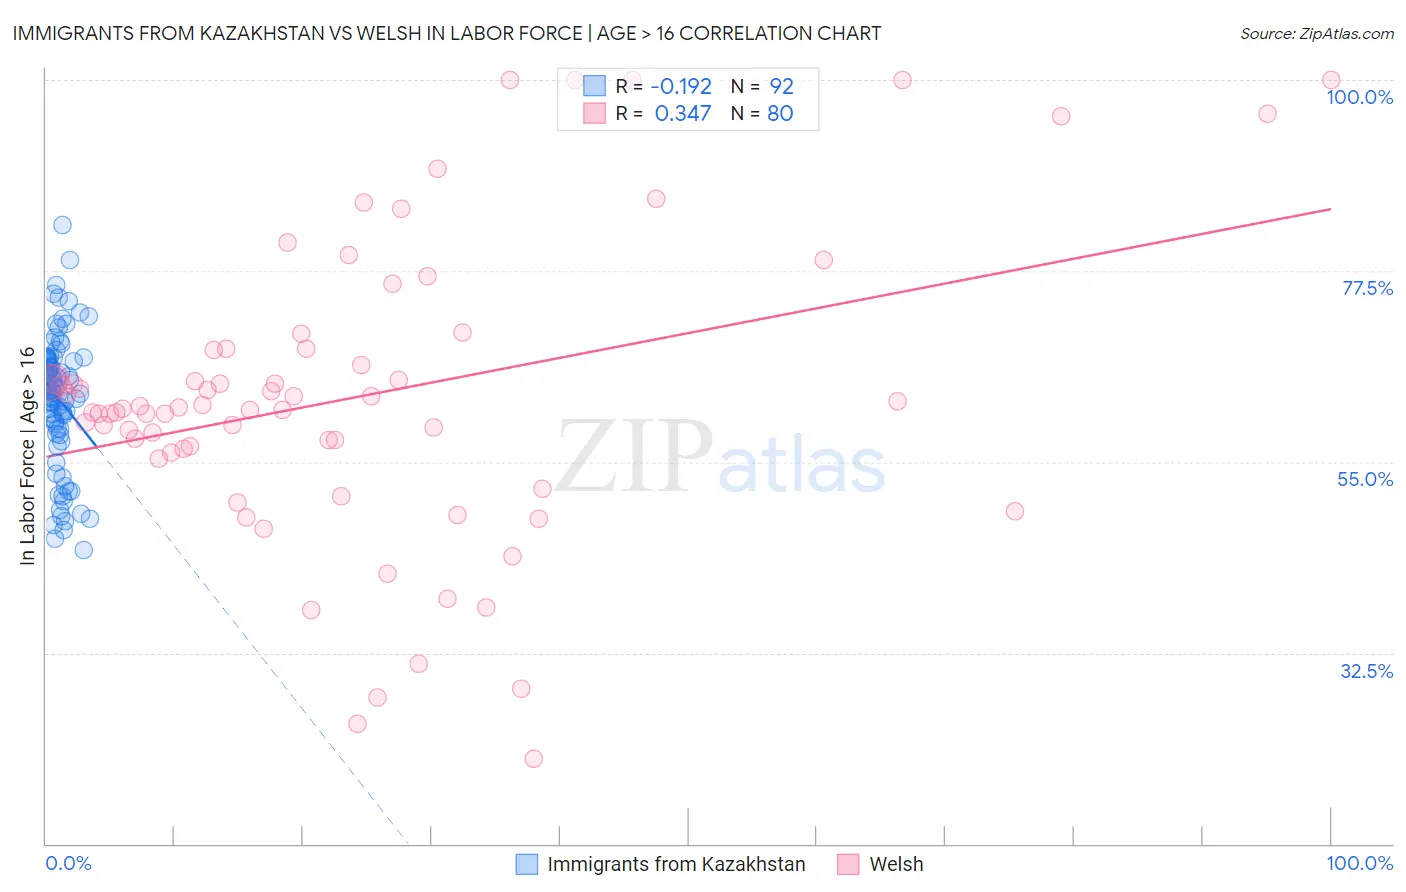
Immigrants from Kazakhstan vs Welsh In Labor Force | Age > 16 Correlation Chart
The statistical analysis conducted on geographies consisting of 124,444,172 people shows a poor negative correlation between the proportion of Immigrants from Kazakhstan and labor force participation rate among population ages 16 and over in the United States with a correlation coefficient (R) of -0.192 and weighted average of 65.3%. Similarly, the statistical analysis conducted on geographies consisting of 528,607,710 people shows a mild positive correlation between the proportion of Welsh and labor force participation rate among population ages 16 and over in the United States with a correlation coefficient (R) of 0.347 and weighted average of 64.0%, a difference of 1.9%.
In Labor Force | Age > 16 Correlation Summary
| Measurement | Immigrants from Kazakhstan | Welsh |
| Minimum | 44.6% | 20.0% |
| Maximum | 82.9% | 100.0% |
| Range | 38.3% | 80.0% |
| Mean | 62.4% | 62.6% |
| Median | 63.4% | 61.3% |
| Interquartile 25% (IQ1) | 58.9% | 56.3% |
| Interquartile 75% (IQ3) | 67.1% | 68.3% |
| Interquartile Range (IQR) | 8.1% | 12.0% |
| Standard Deviation (Sample) | 7.8% | 17.5% |
| Standard Deviation (Population) | 7.7% | 17.3% |
Similar Demographics by In Labor Force | Age > 16
Demographics Similar to Immigrants from Kazakhstan by In Labor Force | Age > 16
In terms of in labor force | age > 16, the demographic groups most similar to Immigrants from Kazakhstan are Danish (65.3%, a difference of 0.010%), Immigrants from Western Asia (65.3%, a difference of 0.010%), South African (65.3%, a difference of 0.020%), Immigrants from Belarus (65.2%, a difference of 0.030%), and Australian (65.3%, a difference of 0.040%).
| Demographics | Rating | Rank | In Labor Force | Age > 16 |
| Panamanians | 75.2 /100 | #158 | Good 65.3% |
| Immigrants | Syria | 74.6 /100 | #159 | Good 65.3% |
| Immigrants | South Africa | 73.5 /100 | #160 | Good 65.3% |
| Australians | 71.3 /100 | #161 | Good 65.3% |
| Albanians | 70.8 /100 | #162 | Good 65.3% |
| South Africans | 69.8 /100 | #163 | Good 65.3% |
| Danes | 68.8 /100 | #164 | Good 65.3% |
| Immigrants | Kazakhstan | 68.1 /100 | #165 | Good 65.3% |
| Immigrants | Western Asia | 67.3 /100 | #166 | Good 65.3% |
| Immigrants | Belarus | 66.0 /100 | #167 | Good 65.2% |
| Serbians | 63.5 /100 | #168 | Good 65.2% |
| Arabs | 62.4 /100 | #169 | Good 65.2% |
| Immigrants | Israel | 61.7 /100 | #170 | Good 65.2% |
| Israelis | 61.6 /100 | #171 | Good 65.2% |
| Immigrants | Sweden | 61.3 /100 | #172 | Good 65.2% |
Demographics Similar to Welsh by In Labor Force | Age > 16
In terms of in labor force | age > 16, the demographic groups most similar to Welsh are Immigrants from St. Vincent and the Grenadines (64.0%, a difference of 0.010%), French Canadian (64.0%, a difference of 0.010%), Assyrian/Chaldean/Syriac (64.0%, a difference of 0.030%), Immigrants from Bahamas (64.0%, a difference of 0.060%), and Immigrants from Cuba (64.1%, a difference of 0.090%).
| Demographics | Rating | Rank | In Labor Force | Age > 16 |
| Native Hawaiians | 0.3 /100 | #272 | Tragic 64.1% |
| Hmong | 0.3 /100 | #273 | Tragic 64.1% |
| Immigrants | Cuba | 0.3 /100 | #274 | Tragic 64.1% |
| Mexicans | 0.3 /100 | #275 | Tragic 64.1% |
| French American Indians | 0.3 /100 | #276 | Tragic 64.1% |
| Immigrants | Bahamas | 0.3 /100 | #277 | Tragic 64.0% |
| Assyrians/Chaldeans/Syriacs | 0.3 /100 | #278 | Tragic 64.0% |
| Welsh | 0.2 /100 | #279 | Tragic 64.0% |
| Immigrants | St. Vincent and the Grenadines | 0.2 /100 | #280 | Tragic 64.0% |
| French Canadians | 0.2 /100 | #281 | Tragic 64.0% |
| Immigrants | Guyana | 0.2 /100 | #282 | Tragic 64.0% |
| Immigrants | Germany | 0.1 /100 | #283 | Tragic 63.9% |
| French | 0.1 /100 | #284 | Tragic 63.9% |
| Slovaks | 0.1 /100 | #285 | Tragic 63.9% |
| Immigrants | Austria | 0.1 /100 | #286 | Tragic 63.9% |