Immigrants from Philippines vs Panamanian In Labor Force | Age 30-34
COMPARE
Immigrants from Philippines
Panamanian
In Labor Force | Age 30-34
In Labor Force | Age 30-34 Comparison
Immigrants from Philippines
Panamanians
84.6%
IN LABOR FORCE | AGE 30-34
31.5/ 100
METRIC RATING
185th/ 347
METRIC RANK
84.2%
IN LABOR FORCE | AGE 30-34
3.8/ 100
METRIC RATING
222nd/ 347
METRIC RANK
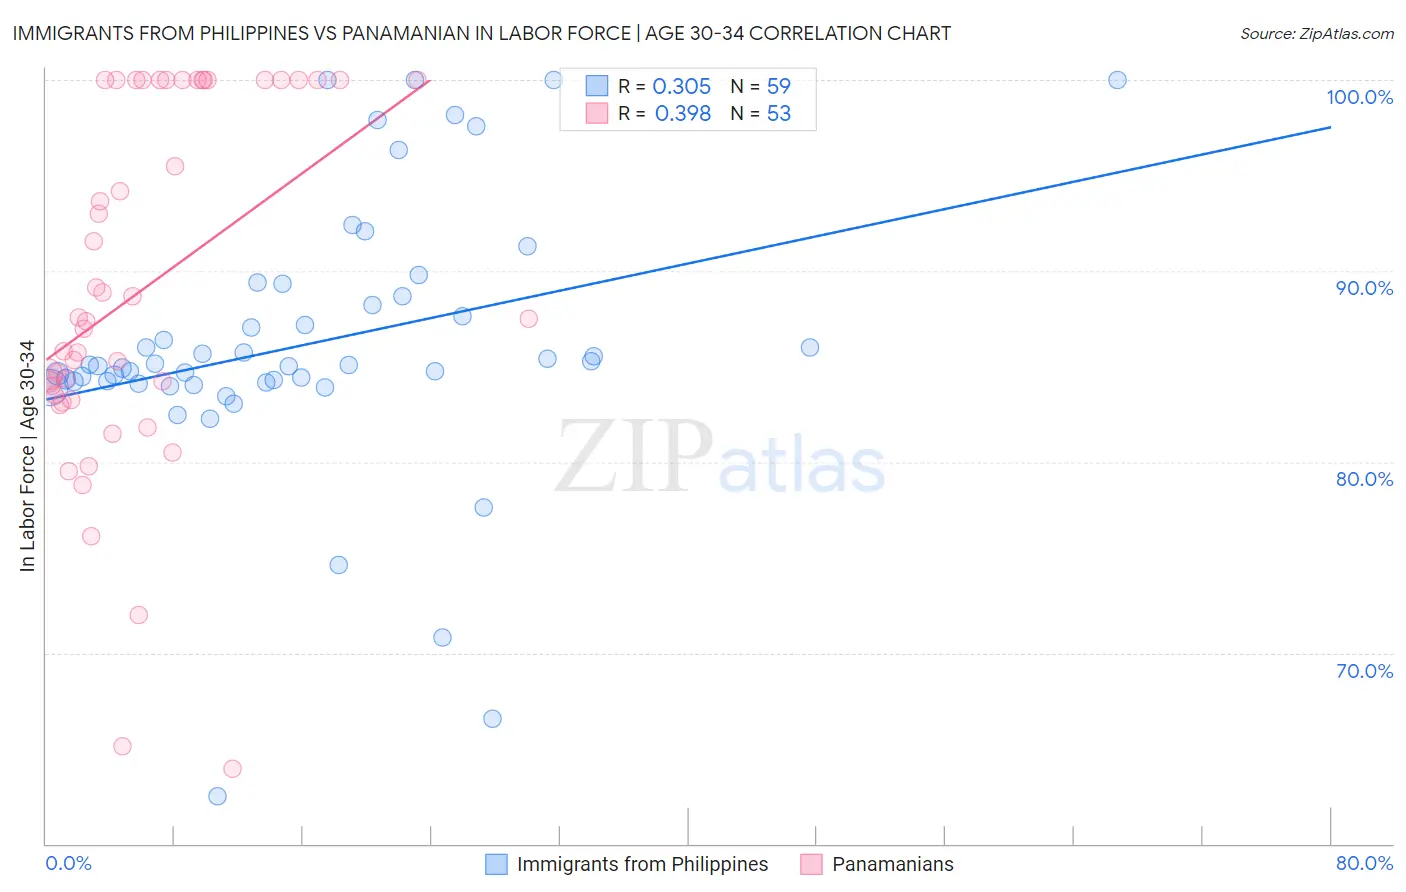
Immigrants from Philippines vs Panamanian In Labor Force | Age 30-34 Correlation Chart
The statistical analysis conducted on geographies consisting of 471,048,330 people shows a mild positive correlation between the proportion of Immigrants from Philippines and labor force participation rate among population between the ages 30 and 34 in the United States with a correlation coefficient (R) of 0.305 and weighted average of 84.6%. Similarly, the statistical analysis conducted on geographies consisting of 281,117,807 people shows a mild positive correlation between the proportion of Panamanians and labor force participation rate among population between the ages 30 and 34 in the United States with a correlation coefficient (R) of 0.398 and weighted average of 84.2%, a difference of 0.43%.
In Labor Force | Age 30-34 Correlation Summary
| Measurement | Immigrants from Philippines | Panamanian |
| Minimum | 62.5% | 63.9% |
| Maximum | 100.0% | 100.0% |
| Range | 37.5% | 36.1% |
| Mean | 86.2% | 89.1% |
| Median | 85.0% | 87.5% |
| Interquartile 25% (IQ1) | 84.2% | 83.4% |
| Interquartile 75% (IQ3) | 88.7% | 100.0% |
| Interquartile Range (IQR) | 4.5% | 16.6% |
| Standard Deviation (Sample) | 7.1% | 9.4% |
| Standard Deviation (Population) | 7.1% | 9.3% |
Similar Demographics by In Labor Force | Age 30-34
Demographics Similar to Immigrants from Philippines by In Labor Force | Age 30-34
In terms of in labor force | age 30-34, the demographic groups most similar to Immigrants from Philippines are Immigrants from North America (84.6%, a difference of 0.010%), Immigrants from Congo (84.6%, a difference of 0.010%), Costa Rican (84.6%, a difference of 0.020%), Taiwanese (84.6%, a difference of 0.020%), and Nigerian (84.5%, a difference of 0.020%).
| Demographics | Rating | Rank | In Labor Force | Age 30-34 |
| Okinawans | 44.1 /100 | #178 | Average 84.6% |
| Immigrants | Nigeria | 42.5 /100 | #179 | Average 84.6% |
| Immigrants | Netherlands | 42.1 /100 | #180 | Average 84.6% |
| Moroccans | 40.3 /100 | #181 | Average 84.6% |
| Barbadians | 36.7 /100 | #182 | Fair 84.6% |
| Immigrants | Canada | 35.0 /100 | #183 | Fair 84.6% |
| Immigrants | North America | 33.3 /100 | #184 | Fair 84.6% |
| Immigrants | Philippines | 31.5 /100 | #185 | Fair 84.6% |
| Immigrants | Congo | 29.7 /100 | #186 | Fair 84.6% |
| Costa Ricans | 29.6 /100 | #187 | Fair 84.6% |
| Taiwanese | 29.4 /100 | #188 | Fair 84.6% |
| Nigerians | 28.9 /100 | #189 | Fair 84.5% |
| Immigrants | Zaire | 25.8 /100 | #190 | Fair 84.5% |
| Hungarians | 24.8 /100 | #191 | Fair 84.5% |
| Scandinavians | 24.7 /100 | #192 | Fair 84.5% |
Demographics Similar to Panamanians by In Labor Force | Age 30-34
In terms of in labor force | age 30-34, the demographic groups most similar to Panamanians are Salvadoran (84.2%, a difference of 0.0%), Immigrants from Laos (84.2%, a difference of 0.010%), Cuban (84.2%, a difference of 0.020%), Scottish (84.2%, a difference of 0.040%), and Immigrants from El Salvador (84.2%, a difference of 0.040%).
| Demographics | Rating | Rank | In Labor Force | Age 30-34 |
| Europeans | 7.2 /100 | #215 | Tragic 84.3% |
| Immigrants | Ecuador | 7.1 /100 | #216 | Tragic 84.3% |
| Immigrants | Trinidad and Tobago | 7.0 /100 | #217 | Tragic 84.3% |
| Immigrants | Panama | 6.3 /100 | #218 | Tragic 84.3% |
| Swiss | 5.8 /100 | #219 | Tragic 84.3% |
| Danes | 5.3 /100 | #220 | Tragic 84.3% |
| Salvadorans | 3.8 /100 | #221 | Tragic 84.2% |
| Panamanians | 3.8 /100 | #222 | Tragic 84.2% |
| Immigrants | Laos | 3.6 /100 | #223 | Tragic 84.2% |
| Cubans | 3.4 /100 | #224 | Tragic 84.2% |
| Scottish | 3.1 /100 | #225 | Tragic 84.2% |
| Immigrants | El Salvador | 3.0 /100 | #226 | Tragic 84.2% |
| Immigrants | Cuba | 3.0 /100 | #227 | Tragic 84.2% |
| Immigrants | Haiti | 2.8 /100 | #228 | Tragic 84.2% |
| Welsh | 2.7 /100 | #229 | Tragic 84.2% |