Immigrants from West Indies vs Panamanian In Labor Force | Age 30-34
COMPARE
Immigrants from West Indies
Panamanian
In Labor Force | Age 30-34
In Labor Force | Age 30-34 Comparison
Immigrants from West Indies
Panamanians
84.5%
IN LABOR FORCE | AGE 30-34
18.1/ 100
METRIC RATING
202nd/ 347
METRIC RANK
84.2%
IN LABOR FORCE | AGE 30-34
3.8/ 100
METRIC RATING
222nd/ 347
METRIC RANK
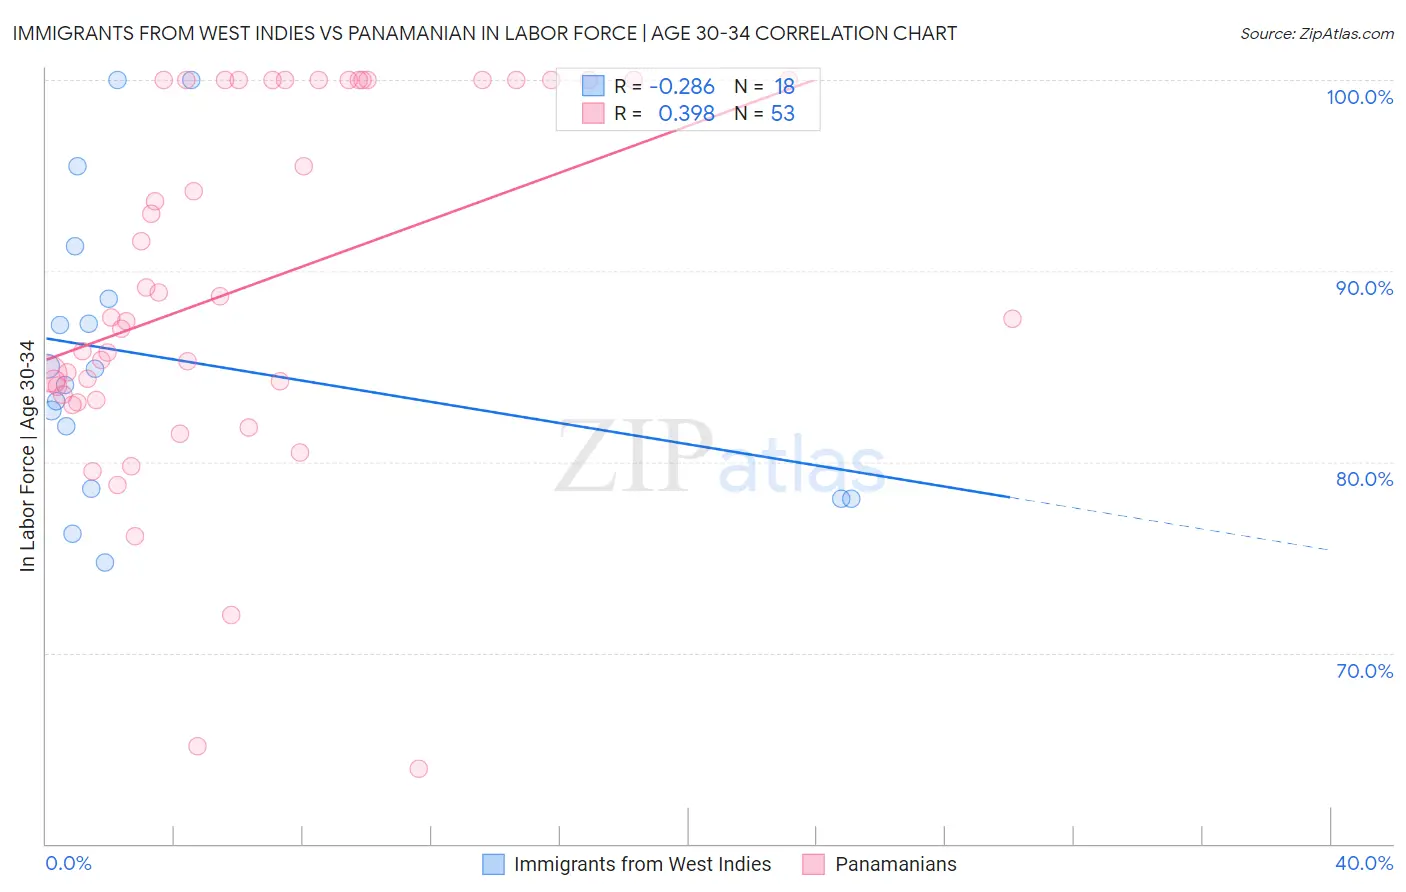
Immigrants from West Indies vs Panamanian In Labor Force | Age 30-34 Correlation Chart
The statistical analysis conducted on geographies consisting of 72,450,455 people shows a weak negative correlation between the proportion of Immigrants from West Indies and labor force participation rate among population between the ages 30 and 34 in the United States with a correlation coefficient (R) of -0.286 and weighted average of 84.5%. Similarly, the statistical analysis conducted on geographies consisting of 281,117,807 people shows a mild positive correlation between the proportion of Panamanians and labor force participation rate among population between the ages 30 and 34 in the United States with a correlation coefficient (R) of 0.398 and weighted average of 84.2%, a difference of 0.30%.
In Labor Force | Age 30-34 Correlation Summary
| Measurement | Immigrants from West Indies | Panamanian |
| Minimum | 74.7% | 63.9% |
| Maximum | 100.0% | 100.0% |
| Range | 25.3% | 36.1% |
| Mean | 85.4% | 89.1% |
| Median | 84.5% | 87.5% |
| Interquartile 25% (IQ1) | 78.6% | 83.4% |
| Interquartile 75% (IQ3) | 88.6% | 100.0% |
| Interquartile Range (IQR) | 10.0% | 16.6% |
| Standard Deviation (Sample) | 7.5% | 9.4% |
| Standard Deviation (Population) | 7.3% | 9.3% |
Demographics Similar to Immigrants from West Indies and Panamanians by In Labor Force | Age 30-34
In terms of in labor force | age 30-34, the demographic groups most similar to Immigrants from West Indies are Canadian (84.4%, a difference of 0.030%), Ecuadorian (84.4%, a difference of 0.050%), French (84.4%, a difference of 0.060%), Lebanese (84.4%, a difference of 0.11%), and Bangladeshi (84.3%, a difference of 0.13%). Similarly, the demographic groups most similar to Panamanians are Salvadoran (84.2%, a difference of 0.0%), Danish (84.3%, a difference of 0.060%), Swiss (84.3%, a difference of 0.080%), Immigrants from Panama (84.3%, a difference of 0.090%), and Immigrants from Germany (84.3%, a difference of 0.12%).
| Demographics | Rating | Rank | In Labor Force | Age 30-34 |
| Immigrants | West Indies | 18.1 /100 | #202 | Poor 84.5% |
| Canadians | 15.4 /100 | #203 | Poor 84.4% |
| Ecuadorians | 14.2 /100 | #204 | Poor 84.4% |
| French | 13.8 /100 | #205 | Poor 84.4% |
| Lebanese | 10.6 /100 | #206 | Poor 84.4% |
| Bangladeshis | 9.4 /100 | #207 | Tragic 84.3% |
| Arabs | 8.9 /100 | #208 | Tragic 84.3% |
| Jamaicans | 8.8 /100 | #209 | Tragic 84.3% |
| Indonesians | 8.8 /100 | #210 | Tragic 84.3% |
| Japanese | 8.8 /100 | #211 | Tragic 84.3% |
| Immigrants | Western Asia | 8.2 /100 | #212 | Tragic 84.3% |
| Immigrants | Jamaica | 7.9 /100 | #213 | Tragic 84.3% |
| Immigrants | Germany | 7.2 /100 | #214 | Tragic 84.3% |
| Europeans | 7.2 /100 | #215 | Tragic 84.3% |
| Immigrants | Ecuador | 7.1 /100 | #216 | Tragic 84.3% |
| Immigrants | Trinidad and Tobago | 7.0 /100 | #217 | Tragic 84.3% |
| Immigrants | Panama | 6.3 /100 | #218 | Tragic 84.3% |
| Swiss | 5.8 /100 | #219 | Tragic 84.3% |
| Danes | 5.3 /100 | #220 | Tragic 84.3% |
| Salvadorans | 3.8 /100 | #221 | Tragic 84.2% |
| Panamanians | 3.8 /100 | #222 | Tragic 84.2% |