Yup'ik vs Korean Median Household Income
COMPARE
Yup'ik
Korean
Median Household Income
Median Household Income Comparison
Yup'ik
Koreans
$69,695
MEDIAN HOUSEHOLD INCOME
0.0/ 100
METRIC RATING
324th/ 347
METRIC RANK
$95,018
MEDIAN HOUSEHOLD INCOME
99.8/ 100
METRIC RATING
60th/ 347
METRIC RANK
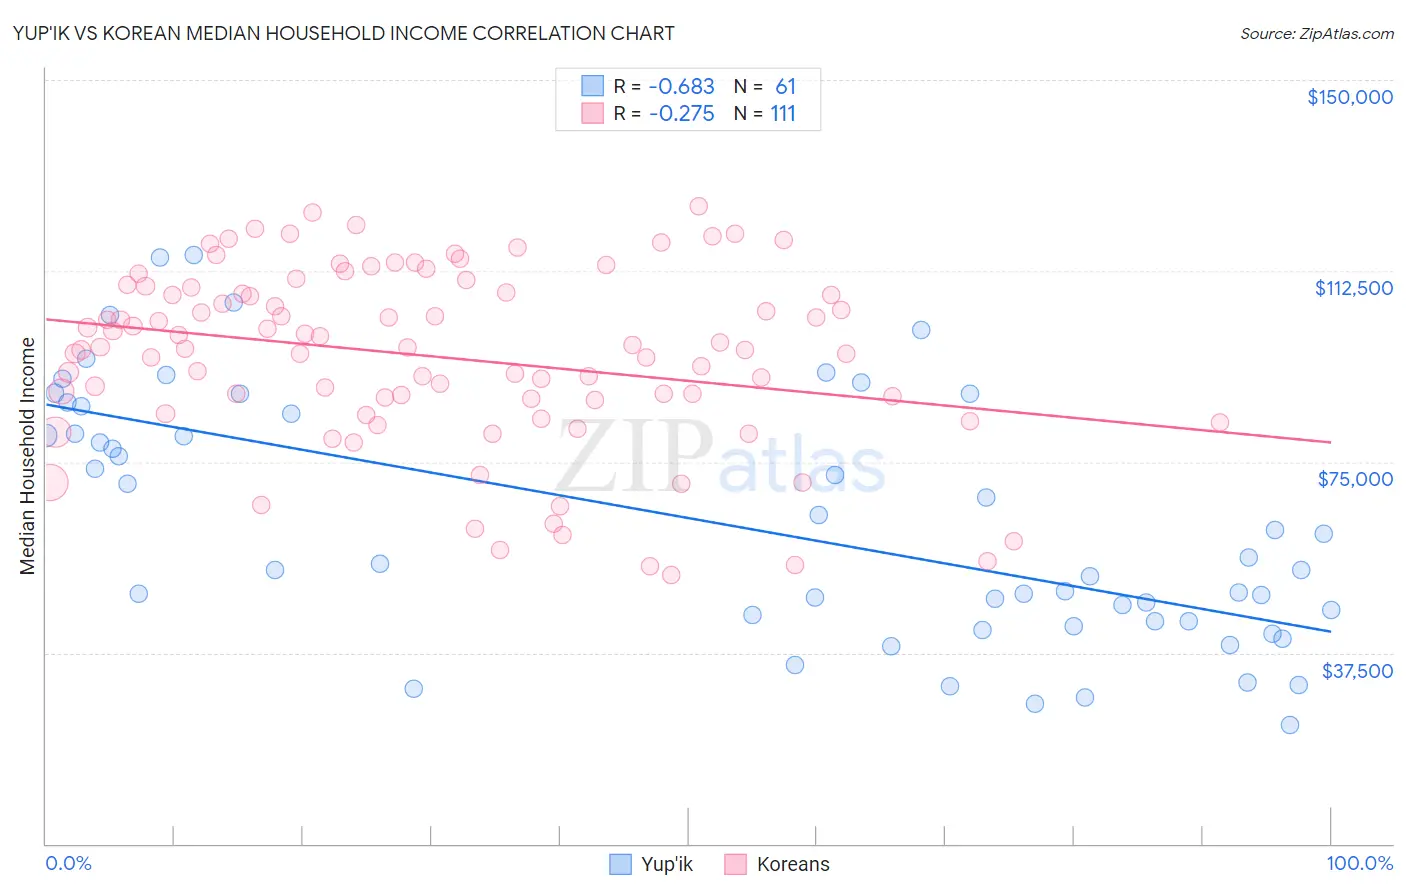
Yup'ik vs Korean Median Household Income Correlation Chart
The statistical analysis conducted on geographies consisting of 39,952,449 people shows a significant negative correlation between the proportion of Yup'ik and median household income in the United States with a correlation coefficient (R) of -0.683 and weighted average of $69,695. Similarly, the statistical analysis conducted on geographies consisting of 510,219,050 people shows a weak negative correlation between the proportion of Koreans and median household income in the United States with a correlation coefficient (R) of -0.275 and weighted average of $95,018, a difference of 36.3%.
Median Household Income Correlation Summary
| Measurement | Yup'ik | Korean |
| Minimum | $23,333 | $52,792 |
| Maximum | $115,625 | $125,300 |
| Range | $92,292 | $72,508 |
| Mean | $62,948 | $95,651 |
| Median | $55,000 | $97,407 |
| Interquartile 25% (IQ1) | $43,673 | $87,266 |
| Interquartile 75% (IQ3) | $85,198 | $109,366 |
| Interquartile Range (IQR) | $41,525 | $22,100 |
| Standard Deviation (Sample) | $24,365 | $17,558 |
| Standard Deviation (Population) | $24,165 | $17,478 |
Similar Demographics by Median Household Income
Demographics Similar to Yup'ik by Median Household Income
In terms of median household income, the demographic groups most similar to Yup'ik are Bahamian ($69,726, a difference of 0.040%), Choctaw ($69,947, a difference of 0.36%), Seminole ($69,420, a difference of 0.40%), Chickasaw ($70,005, a difference of 0.45%), and Colville ($70,094, a difference of 0.57%).
| Demographics | Rating | Rank | Median Household Income |
| Cajuns | 0.0 /100 | #317 | Tragic $70,605 |
| Chippewa | 0.0 /100 | #318 | Tragic $70,539 |
| Immigrants | Dominican Republic | 0.0 /100 | #319 | Tragic $70,208 |
| Colville | 0.0 /100 | #320 | Tragic $70,094 |
| Chickasaw | 0.0 /100 | #321 | Tragic $70,005 |
| Choctaw | 0.0 /100 | #322 | Tragic $69,947 |
| Bahamians | 0.0 /100 | #323 | Tragic $69,726 |
| Yup'ik | 0.0 /100 | #324 | Tragic $69,695 |
| Seminole | 0.0 /100 | #325 | Tragic $69,420 |
| Yuman | 0.0 /100 | #326 | Tragic $68,743 |
| Immigrants | Cuba | 0.0 /100 | #327 | Tragic $68,461 |
| Menominee | 0.0 /100 | #328 | Tragic $68,423 |
| Dutch West Indians | 0.0 /100 | #329 | Tragic $68,412 |
| Arapaho | 0.0 /100 | #330 | Tragic $67,965 |
| Natives/Alaskans | 0.0 /100 | #331 | Tragic $67,879 |
Demographics Similar to Koreans by Median Household Income
In terms of median household income, the demographic groups most similar to Koreans are Immigrants from Europe ($95,032, a difference of 0.020%), Laotian ($94,990, a difference of 0.030%), Soviet Union ($95,098, a difference of 0.080%), New Zealander ($95,146, a difference of 0.13%), and Immigrants from Norway ($94,846, a difference of 0.18%).
| Demographics | Rating | Rank | Median Household Income |
| Paraguayans | 99.9 /100 | #53 | Exceptional $95,737 |
| Egyptians | 99.9 /100 | #54 | Exceptional $95,673 |
| Immigrants | Czechoslovakia | 99.9 /100 | #55 | Exceptional $95,319 |
| Immigrants | Austria | 99.9 /100 | #56 | Exceptional $95,277 |
| New Zealanders | 99.8 /100 | #57 | Exceptional $95,146 |
| Soviet Union | 99.8 /100 | #58 | Exceptional $95,098 |
| Immigrants | Europe | 99.8 /100 | #59 | Exceptional $95,032 |
| Koreans | 99.8 /100 | #60 | Exceptional $95,018 |
| Laotians | 99.8 /100 | #61 | Exceptional $94,990 |
| Immigrants | Norway | 99.8 /100 | #62 | Exceptional $94,846 |
| Greeks | 99.8 /100 | #63 | Exceptional $94,735 |
| Immigrants | Netherlands | 99.7 /100 | #64 | Exceptional $94,411 |
| Immigrants | Belarus | 99.7 /100 | #65 | Exceptional $94,399 |
| Immigrants | Romania | 99.7 /100 | #66 | Exceptional $94,222 |
| Immigrants | Scotland | 99.7 /100 | #67 | Exceptional $94,091 |