Immigrants from Latvia vs Korean In Labor Force | Age 30-34
COMPARE
Immigrants from Latvia
Korean
In Labor Force | Age 30-34
In Labor Force | Age 30-34 Comparison
Immigrants from Latvia
Koreans
85.9%
IN LABOR FORCE | AGE 30-34
100.0/ 100
METRIC RATING
28th/ 347
METRIC RANK
84.5%
IN LABOR FORCE | AGE 30-34
23.2/ 100
METRIC RATING
195th/ 347
METRIC RANK
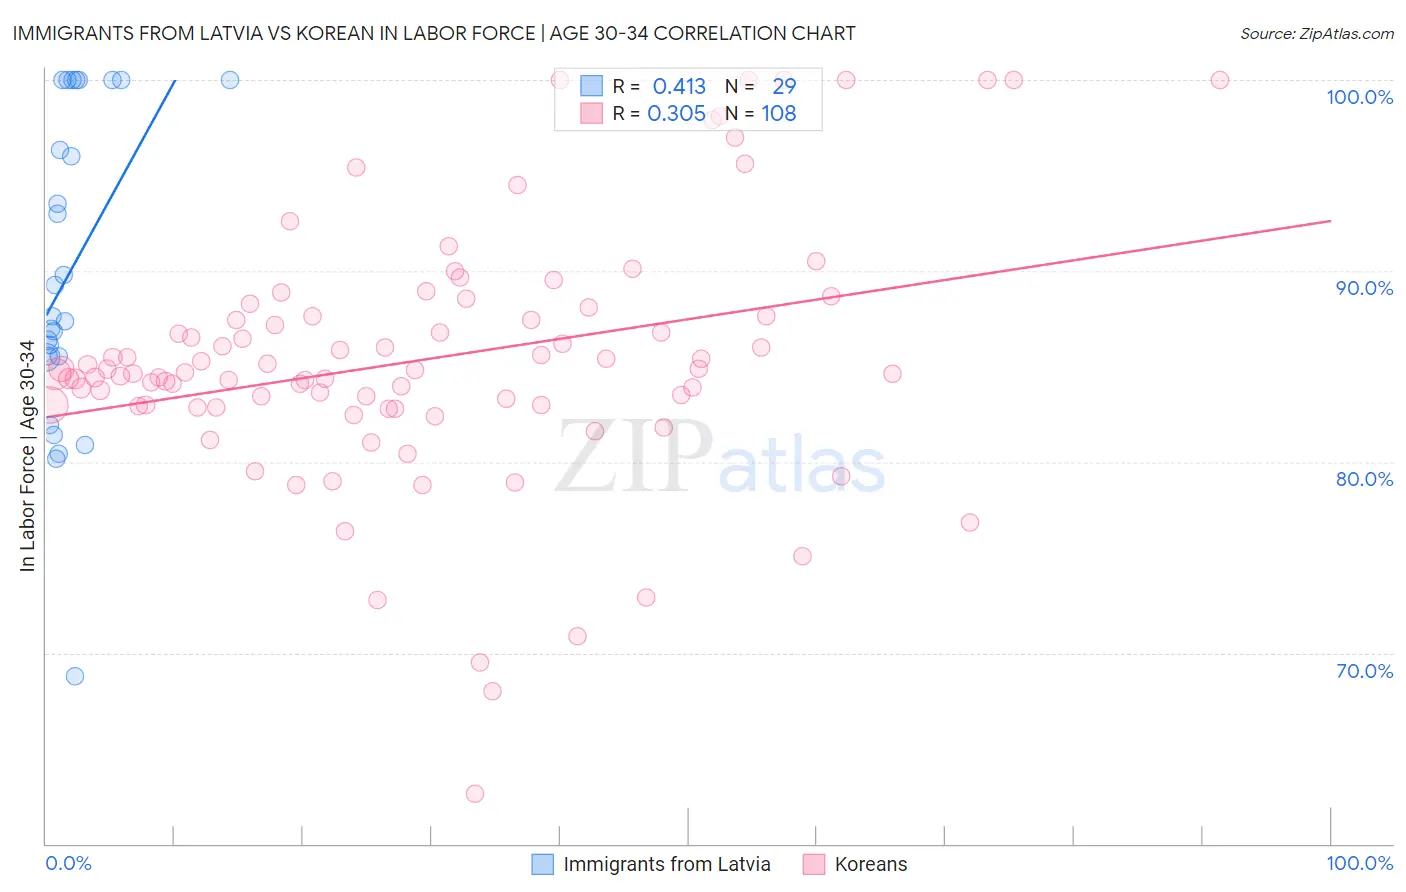
Immigrants from Latvia vs Korean In Labor Force | Age 30-34 Correlation Chart
The statistical analysis conducted on geographies consisting of 113,732,113 people shows a moderate positive correlation between the proportion of Immigrants from Latvia and labor force participation rate among population between the ages 30 and 34 in the United States with a correlation coefficient (R) of 0.413 and weighted average of 85.9%. Similarly, the statistical analysis conducted on geographies consisting of 510,404,908 people shows a mild positive correlation between the proportion of Koreans and labor force participation rate among population between the ages 30 and 34 in the United States with a correlation coefficient (R) of 0.305 and weighted average of 84.5%, a difference of 1.6%.
In Labor Force | Age 30-34 Correlation Summary
| Measurement | Immigrants from Latvia | Korean |
| Minimum | 68.8% | 62.6% |
| Maximum | 100.0% | 100.0% |
| Range | 31.2% | 37.4% |
| Mean | 90.0% | 85.4% |
| Median | 87.6% | 84.7% |
| Interquartile 25% (IQ1) | 85.5% | 83.0% |
| Interquartile 75% (IQ3) | 100.0% | 87.6% |
| Interquartile Range (IQR) | 14.5% | 4.7% |
| Standard Deviation (Sample) | 8.2% | 6.7% |
| Standard Deviation (Population) | 8.0% | 6.7% |
Similar Demographics by In Labor Force | Age 30-34
Demographics Similar to Immigrants from Latvia by In Labor Force | Age 30-34
In terms of in labor force | age 30-34, the demographic groups most similar to Immigrants from Latvia are Tsimshian (85.8%, a difference of 0.030%), Immigrants from Liberia (85.9%, a difference of 0.040%), Immigrants from Eastern Africa (85.9%, a difference of 0.060%), Immigrants from Hong Kong (85.8%, a difference of 0.060%), and Immigrants from Eritrea (85.9%, a difference of 0.070%).
| Demographics | Rating | Rank | In Labor Force | Age 30-34 |
| Immigrants | Bulgaria | 100.0 /100 | #21 | Exceptional 86.0% |
| Bermudans | 100.0 /100 | #22 | Exceptional 85.9% |
| Estonians | 100.0 /100 | #23 | Exceptional 85.9% |
| Immigrants | Eritrea | 100.0 /100 | #24 | Exceptional 85.9% |
| Immigrants | North Macedonia | 100.0 /100 | #25 | Exceptional 85.9% |
| Immigrants | Eastern Africa | 100.0 /100 | #26 | Exceptional 85.9% |
| Immigrants | Liberia | 100.0 /100 | #27 | Exceptional 85.9% |
| Immigrants | Latvia | 100.0 /100 | #28 | Exceptional 85.9% |
| Tsimshian | 100.0 /100 | #29 | Exceptional 85.8% |
| Immigrants | Hong Kong | 100.0 /100 | #30 | Exceptional 85.8% |
| Paraguayans | 99.9 /100 | #31 | Exceptional 85.8% |
| Cypriots | 99.9 /100 | #32 | Exceptional 85.8% |
| Immigrants | Bosnia and Herzegovina | 99.9 /100 | #33 | Exceptional 85.8% |
| Ugandans | 99.9 /100 | #34 | Exceptional 85.8% |
| Serbians | 99.9 /100 | #35 | Exceptional 85.8% |
Demographics Similar to Koreans by In Labor Force | Age 30-34
In terms of in labor force | age 30-34, the demographic groups most similar to Koreans are Immigrants from Afghanistan (84.5%, a difference of 0.0%), British (84.5%, a difference of 0.0%), Scandinavian (84.5%, a difference of 0.010%), Immigrants from Costa Rica (84.5%, a difference of 0.010%), and Immigrants from Syria (84.5%, a difference of 0.010%).
| Demographics | Rating | Rank | In Labor Force | Age 30-34 |
| Taiwanese | 29.4 /100 | #188 | Fair 84.6% |
| Nigerians | 28.9 /100 | #189 | Fair 84.5% |
| Immigrants | Zaire | 25.8 /100 | #190 | Fair 84.5% |
| Hungarians | 24.8 /100 | #191 | Fair 84.5% |
| Scandinavians | 24.7 /100 | #192 | Fair 84.5% |
| Immigrants | Costa Rica | 23.9 /100 | #193 | Fair 84.5% |
| Immigrants | Afghanistan | 23.5 /100 | #194 | Fair 84.5% |
| Koreans | 23.2 /100 | #195 | Fair 84.5% |
| British | 22.9 /100 | #196 | Fair 84.5% |
| Immigrants | Syria | 21.9 /100 | #197 | Fair 84.5% |
| Dutch | 20.2 /100 | #198 | Fair 84.5% |
| Immigrants | Thailand | 19.1 /100 | #199 | Poor 84.5% |
| Sub-Saharan Africans | 19.0 /100 | #200 | Poor 84.5% |
| Trinidadians and Tobagonians | 18.2 /100 | #201 | Poor 84.5% |
| Immigrants | West Indies | 18.1 /100 | #202 | Poor 84.5% |