Yuman vs Jordanian In Labor Force | Age 20-24
COMPARE
Yuman
Jordanian
In Labor Force | Age 20-24
In Labor Force | Age 20-24 Comparison
Yuman
Jordanians
70.3%
IN LABOR FORCE | AGE 20-24
0.0/ 100
METRIC RATING
333rd/ 347
METRIC RANK
75.5%
IN LABOR FORCE | AGE 20-24
84.8/ 100
METRIC RATING
137th/ 347
METRIC RANK
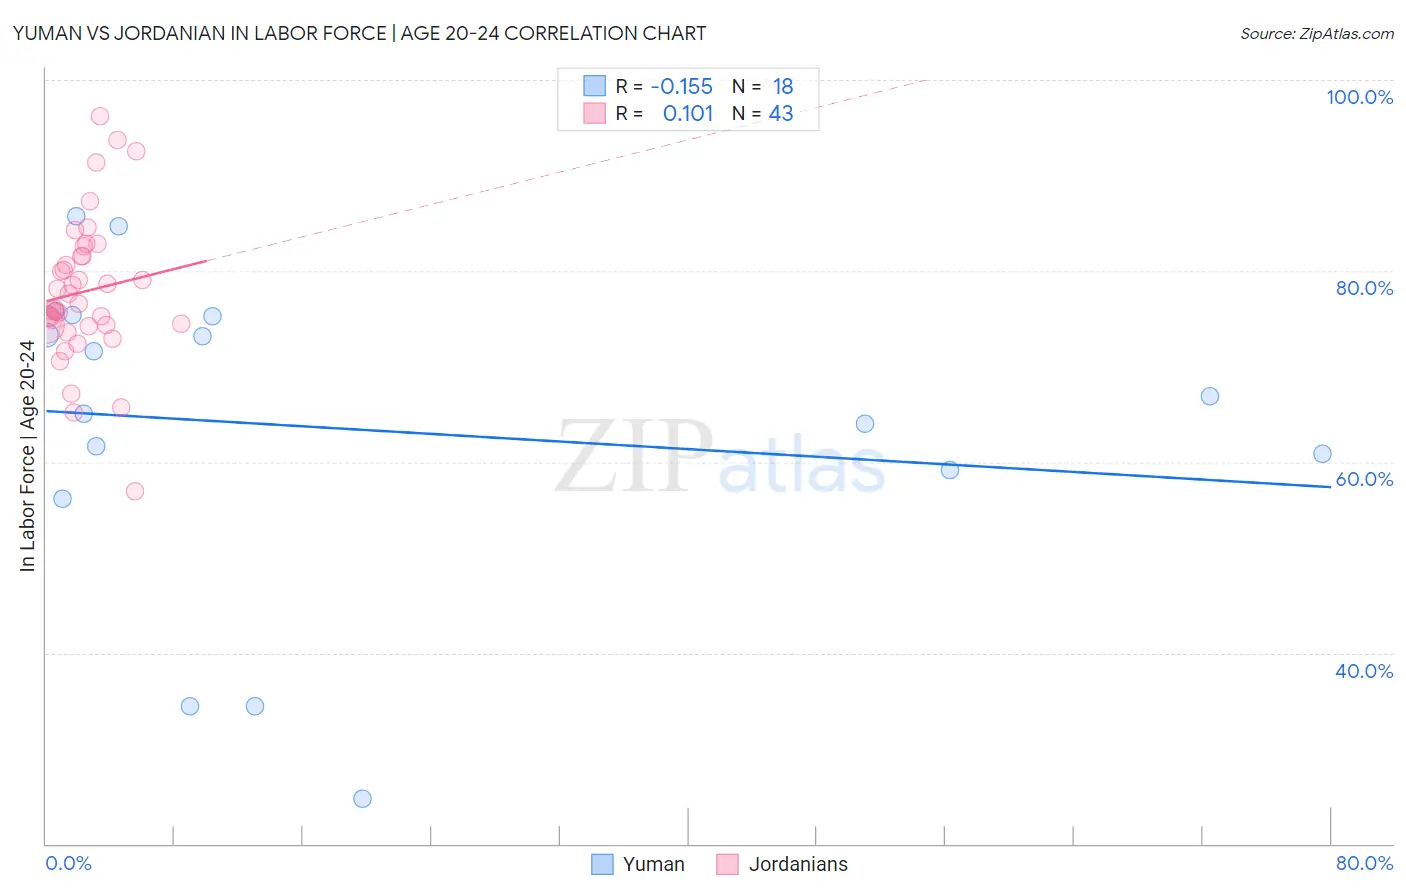
Yuman vs Jordanian In Labor Force | Age 20-24 Correlation Chart
The statistical analysis conducted on geographies consisting of 40,677,141 people shows a poor negative correlation between the proportion of Yuman and labor force participation rate among population between the ages 20 and 24 in the United States with a correlation coefficient (R) of -0.155 and weighted average of 70.3%. Similarly, the statistical analysis conducted on geographies consisting of 166,409,280 people shows a poor positive correlation between the proportion of Jordanians and labor force participation rate among population between the ages 20 and 24 in the United States with a correlation coefficient (R) of 0.101 and weighted average of 75.5%, a difference of 7.5%.
In Labor Force | Age 20-24 Correlation Summary
| Measurement | Yuman | Jordanian |
| Minimum | 24.7% | 56.9% |
| Maximum | 85.7% | 96.2% |
| Range | 61.0% | 39.3% |
| Mean | 63.4% | 77.8% |
| Median | 66.0% | 76.6% |
| Interquartile 25% (IQ1) | 59.1% | 74.3% |
| Interquartile 75% (IQ3) | 75.2% | 81.6% |
| Interquartile Range (IQR) | 16.1% | 7.3% |
| Standard Deviation (Sample) | 17.0% | 7.6% |
| Standard Deviation (Population) | 16.5% | 7.5% |
Similar Demographics by In Labor Force | Age 20-24
Demographics Similar to Yuman by In Labor Force | Age 20-24
In terms of in labor force | age 20-24, the demographic groups most similar to Yuman are Immigrants from Uzbekistan (70.4%, a difference of 0.23%), British West Indian (70.0%, a difference of 0.41%), Immigrants from Bangladesh (70.6%, a difference of 0.53%), Vietnamese (70.6%, a difference of 0.55%), and Immigrants from Barbados (69.7%, a difference of 0.75%).
| Demographics | Rating | Rank | In Labor Force | Age 20-24 |
| Dominicans | 0.0 /100 | #326 | Tragic 71.1% |
| Immigrants | Trinidad and Tobago | 0.0 /100 | #327 | Tragic 71.1% |
| Immigrants | China | 0.0 /100 | #328 | Tragic 71.1% |
| Yup'ik | 0.0 /100 | #329 | Tragic 70.9% |
| Vietnamese | 0.0 /100 | #330 | Tragic 70.6% |
| Immigrants | Bangladesh | 0.0 /100 | #331 | Tragic 70.6% |
| Immigrants | Uzbekistan | 0.0 /100 | #332 | Tragic 70.4% |
| Yuman | 0.0 /100 | #333 | Tragic 70.3% |
| British West Indians | 0.0 /100 | #334 | Tragic 70.0% |
| Immigrants | Barbados | 0.0 /100 | #335 | Tragic 69.7% |
| Immigrants | Guyana | 0.0 /100 | #336 | Tragic 69.3% |
| Guyanese | 0.0 /100 | #337 | Tragic 69.2% |
| Pima | 0.0 /100 | #338 | Tragic 69.0% |
| Immigrants | Yemen | 0.0 /100 | #339 | Tragic 68.9% |
| Menominee | 0.0 /100 | #340 | Tragic 68.7% |
Demographics Similar to Jordanians by In Labor Force | Age 20-24
In terms of in labor force | age 20-24, the demographic groups most similar to Jordanians are Immigrants from Brazil (75.5%, a difference of 0.0%), Australian (75.5%, a difference of 0.0%), Immigrants from England (75.5%, a difference of 0.010%), Delaware (75.5%, a difference of 0.010%), and Yaqui (75.5%, a difference of 0.020%).
| Demographics | Rating | Rank | In Labor Force | Age 20-24 |
| Immigrants | Austria | 88.8 /100 | #130 | Excellent 75.6% |
| Immigrants | Jordan | 88.5 /100 | #131 | Excellent 75.6% |
| Palestinians | 88.4 /100 | #132 | Excellent 75.6% |
| Zimbabweans | 88.2 /100 | #133 | Excellent 75.6% |
| Estonians | 87.1 /100 | #134 | Excellent 75.6% |
| Yaqui | 85.5 /100 | #135 | Excellent 75.5% |
| Immigrants | Brazil | 84.8 /100 | #136 | Excellent 75.5% |
| Jordanians | 84.8 /100 | #137 | Excellent 75.5% |
| Australians | 84.8 /100 | #138 | Excellent 75.5% |
| Immigrants | England | 84.6 /100 | #139 | Excellent 75.5% |
| Delaware | 84.5 /100 | #140 | Excellent 75.5% |
| Romanians | 84.1 /100 | #141 | Excellent 75.5% |
| Blackfeet | 83.6 /100 | #142 | Excellent 75.5% |
| Spaniards | 82.0 /100 | #143 | Excellent 75.5% |
| Bhutanese | 80.8 /100 | #144 | Excellent 75.4% |