Syrian vs Immigrants from Laos In Labor Force | Age 35-44
COMPARE
Syrian
Immigrants from Laos
In Labor Force | Age 35-44
In Labor Force | Age 35-44 Comparison
Syrians
Immigrants from Laos
84.2%
IN LABOR FORCE | AGE 35-44
23.2/ 100
METRIC RATING
199th/ 347
METRIC RANK
83.8%
IN LABOR FORCE | AGE 35-44
1.7/ 100
METRIC RATING
238th/ 347
METRIC RANK
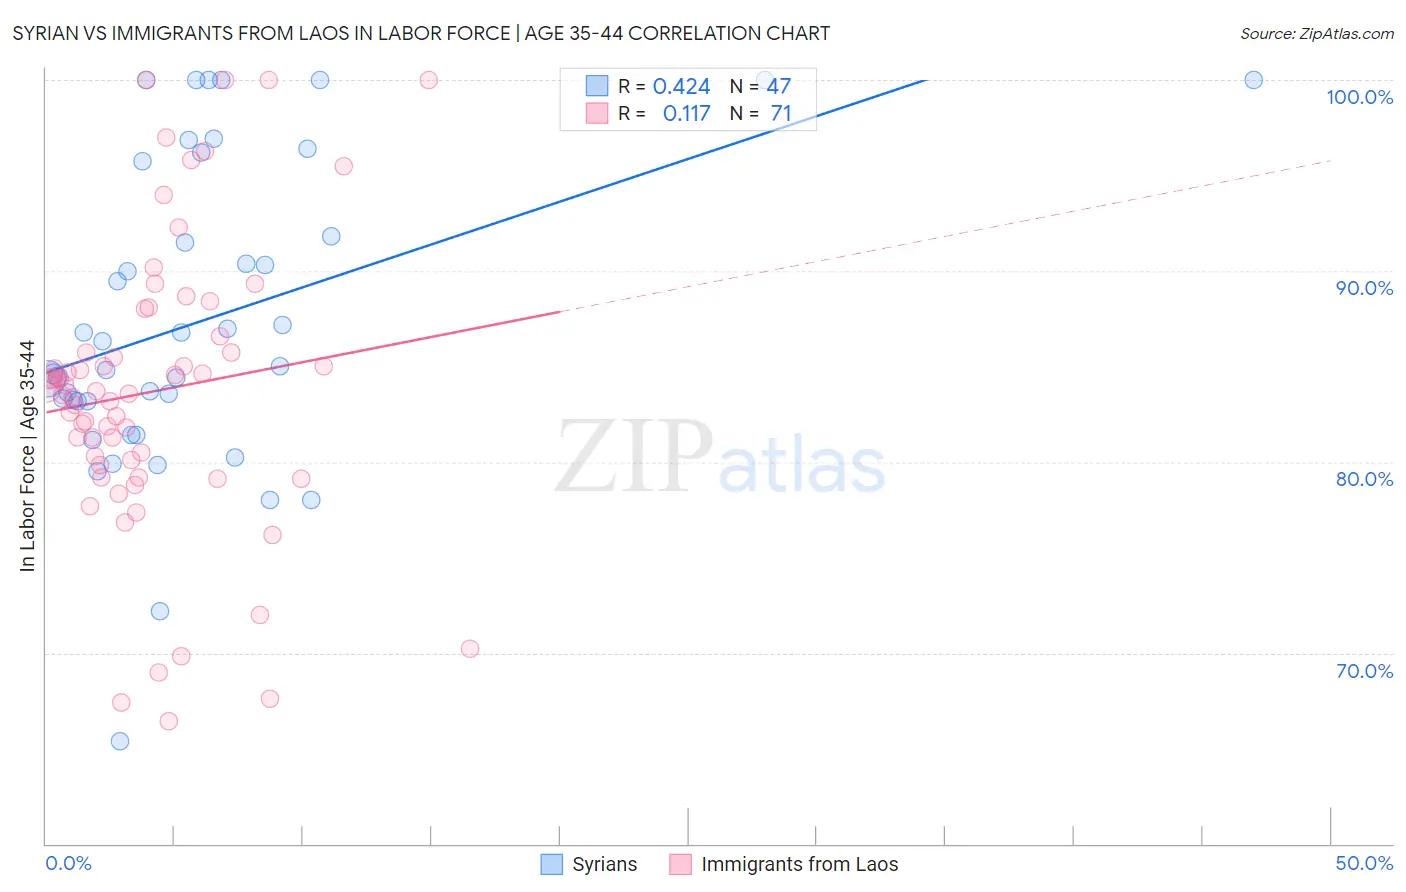
Syrian vs Immigrants from Laos In Labor Force | Age 35-44 Correlation Chart
The statistical analysis conducted on geographies consisting of 266,205,393 people shows a moderate positive correlation between the proportion of Syrians and labor force participation rate among population between the ages 35 and 44 in the United States with a correlation coefficient (R) of 0.424 and weighted average of 84.2%. Similarly, the statistical analysis conducted on geographies consisting of 201,470,158 people shows a poor positive correlation between the proportion of Immigrants from Laos and labor force participation rate among population between the ages 35 and 44 in the United States with a correlation coefficient (R) of 0.117 and weighted average of 83.8%, a difference of 0.47%.
In Labor Force | Age 35-44 Correlation Summary
| Measurement | Syrian | Immigrants from Laos |
| Minimum | 65.3% | 66.4% |
| Maximum | 100.0% | 100.0% |
| Range | 34.7% | 33.6% |
| Mean | 87.4% | 83.7% |
| Median | 85.0% | 83.7% |
| Interquartile 25% (IQ1) | 83.2% | 79.8% |
| Interquartile 75% (IQ3) | 95.7% | 86.6% |
| Interquartile Range (IQR) | 12.6% | 6.8% |
| Standard Deviation (Sample) | 8.0% | 7.6% |
| Standard Deviation (Population) | 8.0% | 7.5% |
Similar Demographics by In Labor Force | Age 35-44
Demographics Similar to Syrians by In Labor Force | Age 35-44
In terms of in labor force | age 35-44, the demographic groups most similar to Syrians are Moroccan (84.2%, a difference of 0.0%), British (84.2%, a difference of 0.0%), Immigrants from Uzbekistan (84.2%, a difference of 0.0%), Immigrants from Western Europe (84.2%, a difference of 0.010%), and Ecuadorian (84.2%, a difference of 0.010%).
| Demographics | Rating | Rank | In Labor Force | Age 35-44 |
| Immigrants | Vietnam | 27.4 /100 | #192 | Fair 84.2% |
| Hungarians | 26.8 /100 | #193 | Fair 84.2% |
| Immigrants | Indonesia | 25.7 /100 | #194 | Fair 84.2% |
| Immigrants | Caribbean | 25.7 /100 | #195 | Fair 84.2% |
| Immigrants | England | 25.0 /100 | #196 | Fair 84.2% |
| Immigrants | Western Europe | 24.7 /100 | #197 | Fair 84.2% |
| Ecuadorians | 24.0 /100 | #198 | Fair 84.2% |
| Syrians | 23.2 /100 | #199 | Fair 84.2% |
| Moroccans | 23.2 /100 | #200 | Fair 84.2% |
| British | 23.0 /100 | #201 | Fair 84.2% |
| Immigrants | Uzbekistan | 22.8 /100 | #202 | Fair 84.2% |
| Immigrants | South Eastern Asia | 22.4 /100 | #203 | Fair 84.2% |
| Canadians | 19.9 /100 | #204 | Poor 84.2% |
| Immigrants | Canada | 19.6 /100 | #205 | Poor 84.2% |
| Immigrants | Costa Rica | 19.5 /100 | #206 | Poor 84.2% |
Demographics Similar to Immigrants from Laos by In Labor Force | Age 35-44
In terms of in labor force | age 35-44, the demographic groups most similar to Immigrants from Laos are English (83.8%, a difference of 0.020%), Celtic (83.8%, a difference of 0.030%), Arab (83.8%, a difference of 0.040%), Iraqi (83.8%, a difference of 0.040%), and Immigrants from Syria (83.9%, a difference of 0.060%).
| Demographics | Rating | Rank | In Labor Force | Age 35-44 |
| Scottish | 3.2 /100 | #231 | Tragic 83.9% |
| Native Hawaiians | 3.0 /100 | #232 | Tragic 83.9% |
| Immigrants | Germany | 2.8 /100 | #233 | Tragic 83.9% |
| Immigrants | Oceania | 2.6 /100 | #234 | Tragic 83.9% |
| Immigrants | Syria | 2.5 /100 | #235 | Tragic 83.9% |
| West Indians | 2.4 /100 | #236 | Tragic 83.9% |
| English | 1.8 /100 | #237 | Tragic 83.8% |
| Immigrants | Laos | 1.7 /100 | #238 | Tragic 83.8% |
| Celtics | 1.4 /100 | #239 | Tragic 83.8% |
| Arabs | 1.3 /100 | #240 | Tragic 83.8% |
| Iraqis | 1.3 /100 | #241 | Tragic 83.8% |
| Immigrants | Cambodia | 1.1 /100 | #242 | Tragic 83.8% |
| Immigrants | Western Asia | 1.1 /100 | #243 | Tragic 83.8% |
| Guyanese | 1.1 /100 | #244 | Tragic 83.8% |
| Malaysians | 1.1 /100 | #245 | Tragic 83.8% |