Australian vs Immigrants from Laos In Labor Force | Age 35-44
COMPARE
Australian
Immigrants from Laos
In Labor Force | Age 35-44
In Labor Force | Age 35-44 Comparison
Australians
Immigrants from Laos
84.3%
IN LABOR FORCE | AGE 35-44
35.1/ 100
METRIC RATING
186th/ 347
METRIC RANK
83.8%
IN LABOR FORCE | AGE 35-44
1.7/ 100
METRIC RATING
238th/ 347
METRIC RANK
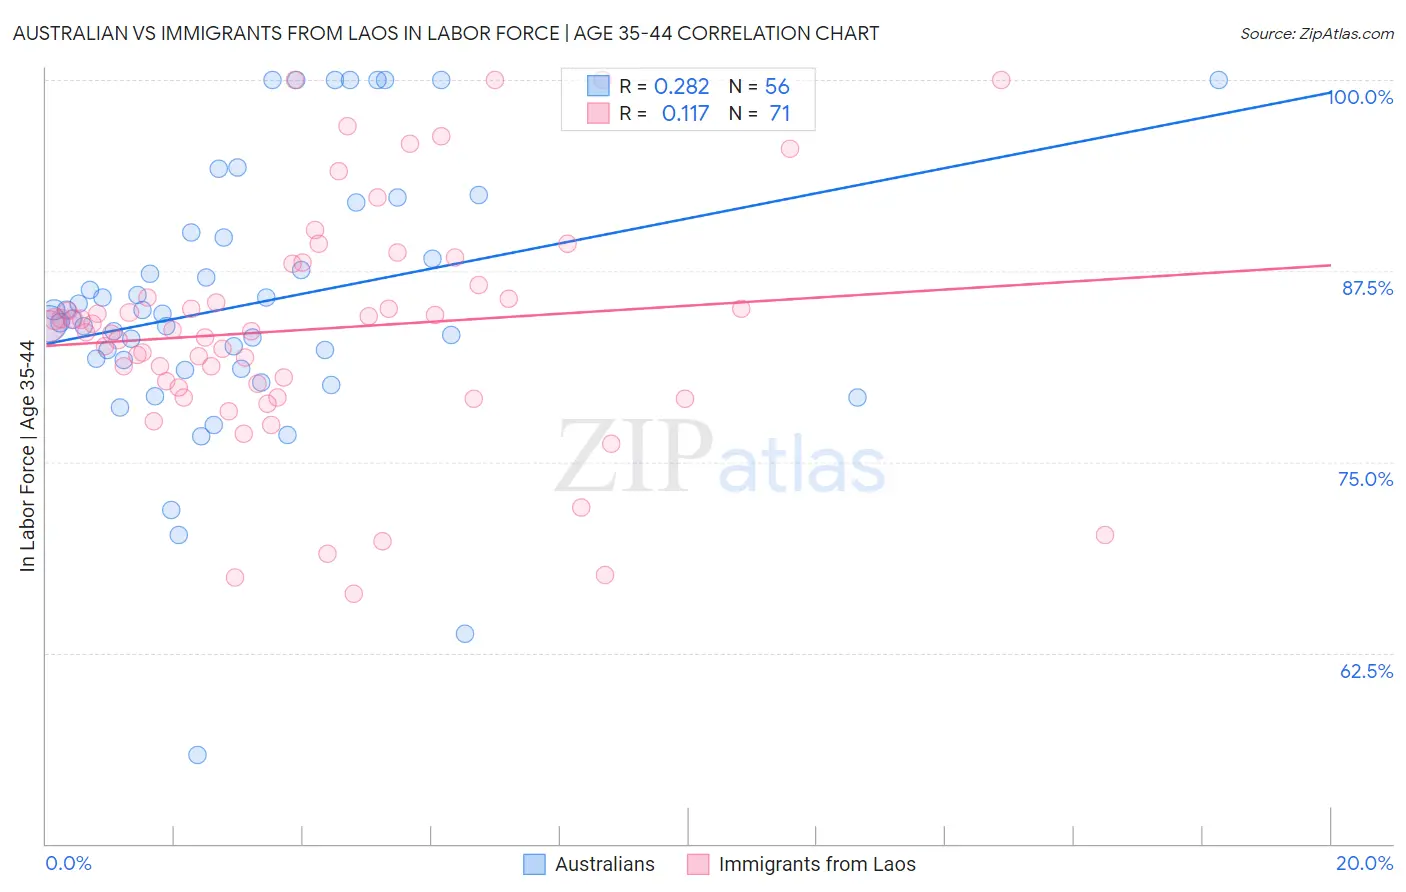
Australian vs Immigrants from Laos In Labor Force | Age 35-44 Correlation Chart
The statistical analysis conducted on geographies consisting of 224,086,573 people shows a weak positive correlation between the proportion of Australians and labor force participation rate among population between the ages 35 and 44 in the United States with a correlation coefficient (R) of 0.282 and weighted average of 84.3%. Similarly, the statistical analysis conducted on geographies consisting of 201,470,158 people shows a poor positive correlation between the proportion of Immigrants from Laos and labor force participation rate among population between the ages 35 and 44 in the United States with a correlation coefficient (R) of 0.117 and weighted average of 83.8%, a difference of 0.56%.
In Labor Force | Age 35-44 Correlation Summary
| Measurement | Australian | Immigrants from Laos |
| Minimum | 55.8% | 66.4% |
| Maximum | 100.0% | 100.0% |
| Range | 44.2% | 33.6% |
| Mean | 85.4% | 83.7% |
| Median | 84.5% | 83.7% |
| Interquartile 25% (IQ1) | 81.4% | 79.8% |
| Interquartile 75% (IQ3) | 89.8% | 86.6% |
| Interquartile Range (IQR) | 8.5% | 6.8% |
| Standard Deviation (Sample) | 8.9% | 7.6% |
| Standard Deviation (Population) | 8.8% | 7.5% |
Similar Demographics by In Labor Force | Age 35-44
Demographics Similar to Australians by In Labor Force | Age 35-44
In terms of in labor force | age 35-44, the demographic groups most similar to Australians are Armenian (84.3%, a difference of 0.0%), Costa Rican (84.3%, a difference of 0.0%), Dutch (84.3%, a difference of 0.0%), Immigrants from West Indies (84.3%, a difference of 0.010%), and Korean (84.3%, a difference of 0.010%).
| Demographics | Rating | Rank | In Labor Force | Age 35-44 |
| Immigrants | South Africa | 42.8 /100 | #179 | Average 84.3% |
| Danes | 38.8 /100 | #180 | Fair 84.3% |
| Immigrants | West Indies | 36.4 /100 | #181 | Fair 84.3% |
| Koreans | 36.3 /100 | #182 | Fair 84.3% |
| Barbadians | 36.2 /100 | #183 | Fair 84.3% |
| Armenians | 35.6 /100 | #184 | Fair 84.3% |
| Costa Ricans | 35.3 /100 | #185 | Fair 84.3% |
| Australians | 35.1 /100 | #186 | Fair 84.3% |
| Dutch | 34.8 /100 | #187 | Fair 84.3% |
| South Africans | 34.1 /100 | #188 | Fair 84.3% |
| Immigrants | Denmark | 33.7 /100 | #189 | Fair 84.3% |
| Portuguese | 31.9 /100 | #190 | Fair 84.3% |
| Immigrants | Philippines | 27.9 /100 | #191 | Fair 84.2% |
| Immigrants | Vietnam | 27.4 /100 | #192 | Fair 84.2% |
| Hungarians | 26.8 /100 | #193 | Fair 84.2% |
Demographics Similar to Immigrants from Laos by In Labor Force | Age 35-44
In terms of in labor force | age 35-44, the demographic groups most similar to Immigrants from Laos are English (83.8%, a difference of 0.020%), Celtic (83.8%, a difference of 0.030%), Arab (83.8%, a difference of 0.040%), Iraqi (83.8%, a difference of 0.040%), and Immigrants from Syria (83.9%, a difference of 0.060%).
| Demographics | Rating | Rank | In Labor Force | Age 35-44 |
| Scottish | 3.2 /100 | #231 | Tragic 83.9% |
| Native Hawaiians | 3.0 /100 | #232 | Tragic 83.9% |
| Immigrants | Germany | 2.8 /100 | #233 | Tragic 83.9% |
| Immigrants | Oceania | 2.6 /100 | #234 | Tragic 83.9% |
| Immigrants | Syria | 2.5 /100 | #235 | Tragic 83.9% |
| West Indians | 2.4 /100 | #236 | Tragic 83.9% |
| English | 1.8 /100 | #237 | Tragic 83.8% |
| Immigrants | Laos | 1.7 /100 | #238 | Tragic 83.8% |
| Celtics | 1.4 /100 | #239 | Tragic 83.8% |
| Arabs | 1.3 /100 | #240 | Tragic 83.8% |
| Iraqis | 1.3 /100 | #241 | Tragic 83.8% |
| Immigrants | Cambodia | 1.1 /100 | #242 | Tragic 83.8% |
| Immigrants | Western Asia | 1.1 /100 | #243 | Tragic 83.8% |
| Guyanese | 1.1 /100 | #244 | Tragic 83.8% |
| Malaysians | 1.1 /100 | #245 | Tragic 83.8% |