Paraguayan vs African In Labor Force | Age 35-44
COMPARE
Paraguayan
African
In Labor Force | Age 35-44
In Labor Force | Age 35-44 Comparison
Paraguayans
Africans
85.4%
IN LABOR FORCE | AGE 35-44
99.9/ 100
METRIC RATING
25th/ 347
METRIC RANK
82.9%
IN LABOR FORCE | AGE 35-44
0.0/ 100
METRIC RATING
290th/ 347
METRIC RANK
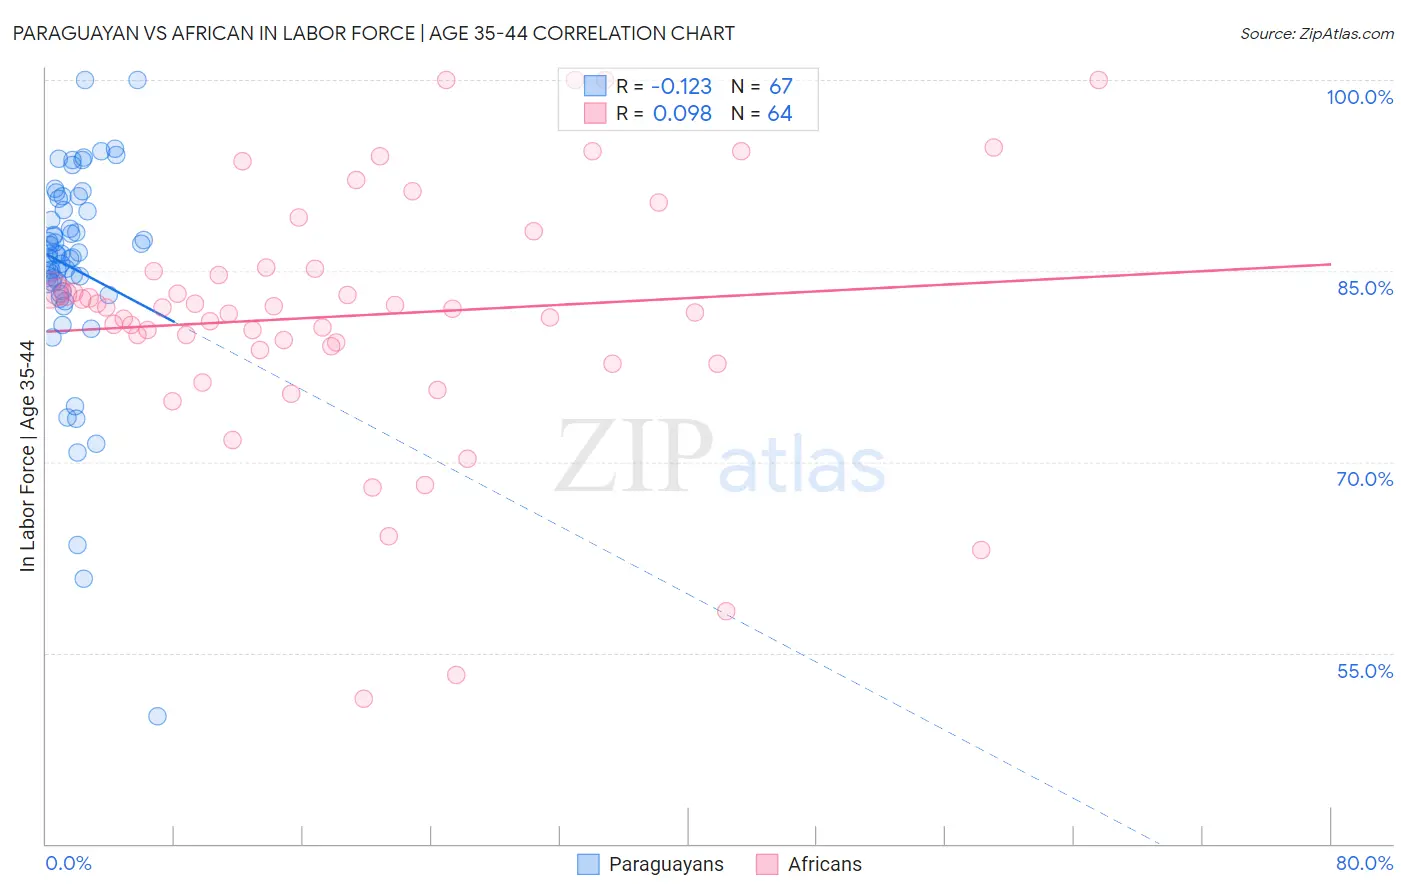
Paraguayan vs African In Labor Force | Age 35-44 Correlation Chart
The statistical analysis conducted on geographies consisting of 95,103,521 people shows a poor negative correlation between the proportion of Paraguayans and labor force participation rate among population between the ages 35 and 44 in the United States with a correlation coefficient (R) of -0.123 and weighted average of 85.4%. Similarly, the statistical analysis conducted on geographies consisting of 469,704,956 people shows a slight positive correlation between the proportion of Africans and labor force participation rate among population between the ages 35 and 44 in the United States with a correlation coefficient (R) of 0.098 and weighted average of 82.9%, a difference of 3.0%.
In Labor Force | Age 35-44 Correlation Summary
| Measurement | Paraguayan | African |
| Minimum | 50.0% | 51.4% |
| Maximum | 100.0% | 100.0% |
| Range | 50.0% | 48.6% |
| Mean | 85.2% | 81.5% |
| Median | 86.2% | 82.1% |
| Interquartile 25% (IQ1) | 83.4% | 79.0% |
| Interquartile 75% (IQ3) | 89.8% | 85.1% |
| Interquartile Range (IQR) | 6.4% | 6.1% |
| Standard Deviation (Sample) | 8.3% | 10.0% |
| Standard Deviation (Population) | 8.3% | 9.9% |
Similar Demographics by In Labor Force | Age 35-44
Demographics Similar to Paraguayans by In Labor Force | Age 35-44
In terms of in labor force | age 35-44, the demographic groups most similar to Paraguayans are Immigrants from Liberia (85.4%, a difference of 0.0%), Immigrants from Lithuania (85.4%, a difference of 0.0%), Latvian (85.4%, a difference of 0.010%), Immigrants from Greece (85.3%, a difference of 0.020%), and Cambodian (85.3%, a difference of 0.060%).
| Demographics | Rating | Rank | In Labor Force | Age 35-44 |
| Carpatho Rusyns | 100.0 /100 | #18 | Exceptional 85.6% |
| Slovenes | 100.0 /100 | #19 | Exceptional 85.6% |
| Immigrants | Serbia | 100.0 /100 | #20 | Exceptional 85.5% |
| Bulgarians | 100.0 /100 | #21 | Exceptional 85.5% |
| Immigrants | Bosnia and Herzegovina | 100.0 /100 | #22 | Exceptional 85.4% |
| Immigrants | Eastern Africa | 100.0 /100 | #23 | Exceptional 85.4% |
| Latvians | 99.9 /100 | #24 | Exceptional 85.4% |
| Paraguayans | 99.9 /100 | #25 | Exceptional 85.4% |
| Immigrants | Liberia | 99.9 /100 | #26 | Exceptional 85.4% |
| Immigrants | Lithuania | 99.9 /100 | #27 | Exceptional 85.4% |
| Immigrants | Greece | 99.9 /100 | #28 | Exceptional 85.3% |
| Cambodians | 99.9 /100 | #29 | Exceptional 85.3% |
| Bermudans | 99.9 /100 | #30 | Exceptional 85.3% |
| Czechs | 99.9 /100 | #31 | Exceptional 85.3% |
| Immigrants | India | 99.9 /100 | #32 | Exceptional 85.3% |
Demographics Similar to Africans by In Labor Force | Age 35-44
In terms of in labor force | age 35-44, the demographic groups most similar to Africans are Chippewa (82.9%, a difference of 0.010%), Pennsylvania German (82.9%, a difference of 0.020%), Puget Sound Salish (82.9%, a difference of 0.030%), Immigrants from Belize (82.9%, a difference of 0.040%), and Fijian (82.9%, a difference of 0.050%).
| Demographics | Rating | Rank | In Labor Force | Age 35-44 |
| Immigrants | Guatemala | 0.0 /100 | #283 | Tragic 82.9% |
| Immigrants | Dominican Republic | 0.0 /100 | #284 | Tragic 82.9% |
| Fijians | 0.0 /100 | #285 | Tragic 82.9% |
| Immigrants | Bangladesh | 0.0 /100 | #286 | Tragic 82.9% |
| Immigrants | Belize | 0.0 /100 | #287 | Tragic 82.9% |
| Puget Sound Salish | 0.0 /100 | #288 | Tragic 82.9% |
| Chippewa | 0.0 /100 | #289 | Tragic 82.9% |
| Africans | 0.0 /100 | #290 | Tragic 82.9% |
| Pennsylvania Germans | 0.0 /100 | #291 | Tragic 82.9% |
| Immigrants | Latin America | 0.0 /100 | #292 | Tragic 82.8% |
| Spanish Americans | 0.0 /100 | #293 | Tragic 82.8% |
| Potawatomi | 0.0 /100 | #294 | Tragic 82.7% |
| Immigrants | Lebanon | 0.0 /100 | #295 | Tragic 82.7% |
| Mexican American Indians | 0.0 /100 | #296 | Tragic 82.6% |
| Hmong | 0.0 /100 | #297 | Tragic 82.6% |