Immigrants from Egypt vs African In Labor Force | Age 35-44
COMPARE
Immigrants from Egypt
African
In Labor Force | Age 35-44
In Labor Force | Age 35-44 Comparison
Immigrants from Egypt
Africans
84.7%
IN LABOR FORCE | AGE 35-44
92.7/ 100
METRIC RATING
116th/ 347
METRIC RANK
82.9%
IN LABOR FORCE | AGE 35-44
0.0/ 100
METRIC RATING
290th/ 347
METRIC RANK
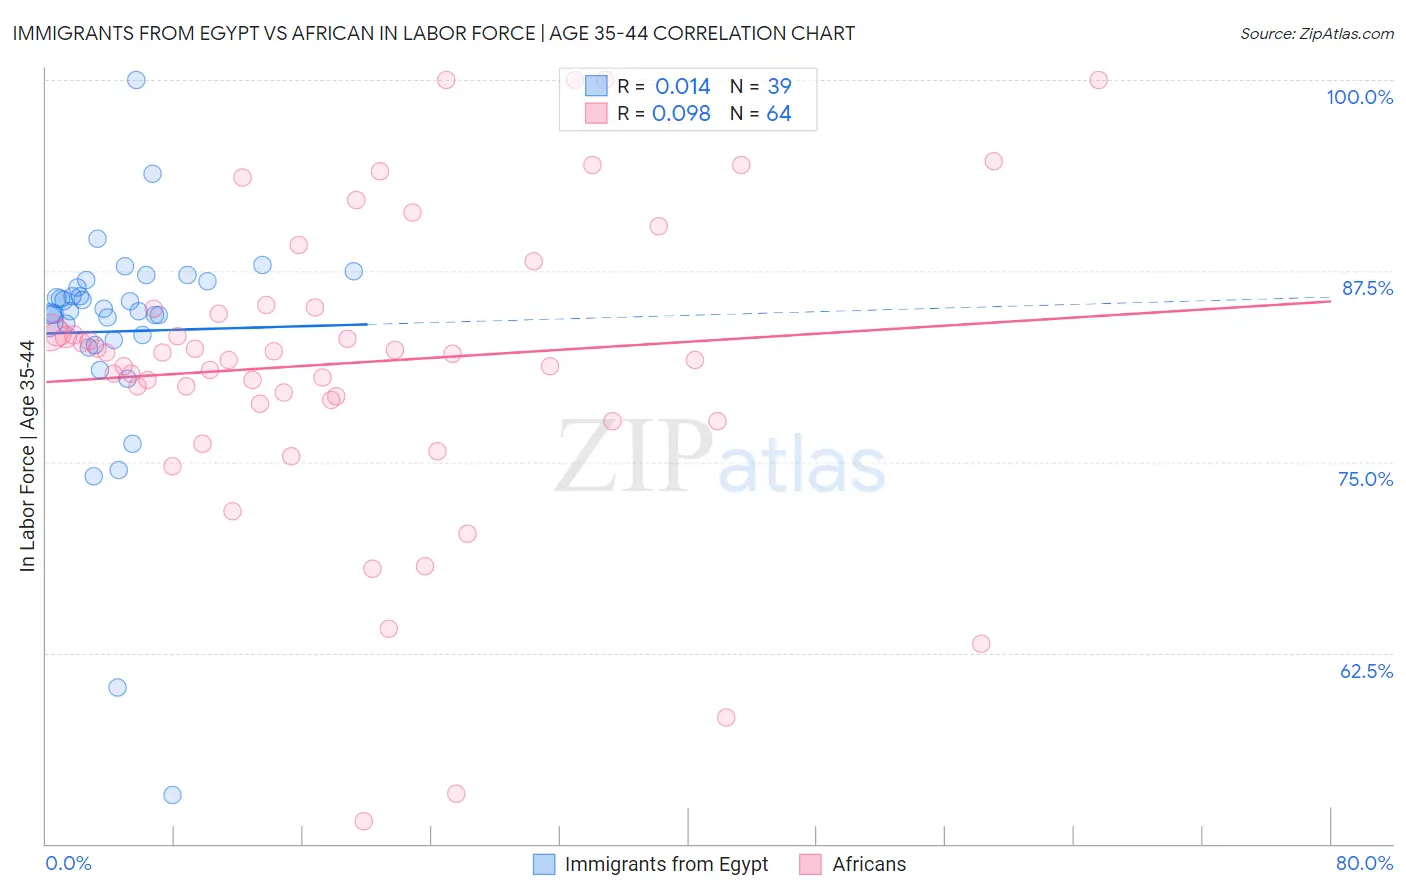
Immigrants from Egypt vs African In Labor Force | Age 35-44 Correlation Chart
The statistical analysis conducted on geographies consisting of 245,437,423 people shows no correlation between the proportion of Immigrants from Egypt and labor force participation rate among population between the ages 35 and 44 in the United States with a correlation coefficient (R) of 0.014 and weighted average of 84.7%. Similarly, the statistical analysis conducted on geographies consisting of 469,704,956 people shows a slight positive correlation between the proportion of Africans and labor force participation rate among population between the ages 35 and 44 in the United States with a correlation coefficient (R) of 0.098 and weighted average of 82.9%, a difference of 2.2%.
In Labor Force | Age 35-44 Correlation Summary
| Measurement | Immigrants from Egypt | African |
| Minimum | 53.2% | 51.4% |
| Maximum | 100.0% | 100.0% |
| Range | 46.8% | 48.6% |
| Mean | 83.5% | 81.5% |
| Median | 84.9% | 82.1% |
| Interquartile 25% (IQ1) | 83.0% | 79.0% |
| Interquartile 75% (IQ3) | 86.8% | 85.1% |
| Interquartile Range (IQR) | 3.8% | 6.1% |
| Standard Deviation (Sample) | 7.7% | 10.0% |
| Standard Deviation (Population) | 7.6% | 9.9% |
Similar Demographics by In Labor Force | Age 35-44
Demographics Similar to Immigrants from Egypt by In Labor Force | Age 35-44
In terms of in labor force | age 35-44, the demographic groups most similar to Immigrants from Egypt are Uruguayan (84.7%, a difference of 0.010%), Chilean (84.7%, a difference of 0.010%), Bahamian (84.7%, a difference of 0.010%), Immigrants from China (84.7%, a difference of 0.010%), and Immigrants from Eastern Asia (84.7%, a difference of 0.010%).
| Demographics | Rating | Rank | In Labor Force | Age 35-44 |
| Immigrants | Russia | 94.5 /100 | #109 | Exceptional 84.8% |
| Filipinos | 93.8 /100 | #110 | Exceptional 84.7% |
| Ukrainians | 93.5 /100 | #111 | Exceptional 84.7% |
| Immigrants | Western Africa | 93.4 /100 | #112 | Exceptional 84.7% |
| Uruguayans | 93.3 /100 | #113 | Exceptional 84.7% |
| Chileans | 93.2 /100 | #114 | Exceptional 84.7% |
| Bahamians | 93.2 /100 | #115 | Exceptional 84.7% |
| Immigrants | Egypt | 92.7 /100 | #116 | Exceptional 84.7% |
| Immigrants | China | 92.3 /100 | #117 | Exceptional 84.7% |
| Immigrants | Eastern Asia | 92.1 /100 | #118 | Exceptional 84.7% |
| Burmese | 91.8 /100 | #119 | Exceptional 84.7% |
| Immigrants | Northern Europe | 91.5 /100 | #120 | Exceptional 84.7% |
| Finns | 91.2 /100 | #121 | Exceptional 84.7% |
| Germans | 91.0 /100 | #122 | Exceptional 84.7% |
| Immigrants | South America | 90.9 /100 | #123 | Exceptional 84.7% |
Demographics Similar to Africans by In Labor Force | Age 35-44
In terms of in labor force | age 35-44, the demographic groups most similar to Africans are Chippewa (82.9%, a difference of 0.010%), Pennsylvania German (82.9%, a difference of 0.020%), Puget Sound Salish (82.9%, a difference of 0.030%), Immigrants from Belize (82.9%, a difference of 0.040%), and Fijian (82.9%, a difference of 0.050%).
| Demographics | Rating | Rank | In Labor Force | Age 35-44 |
| Immigrants | Guatemala | 0.0 /100 | #283 | Tragic 82.9% |
| Immigrants | Dominican Republic | 0.0 /100 | #284 | Tragic 82.9% |
| Fijians | 0.0 /100 | #285 | Tragic 82.9% |
| Immigrants | Bangladesh | 0.0 /100 | #286 | Tragic 82.9% |
| Immigrants | Belize | 0.0 /100 | #287 | Tragic 82.9% |
| Puget Sound Salish | 0.0 /100 | #288 | Tragic 82.9% |
| Chippewa | 0.0 /100 | #289 | Tragic 82.9% |
| Africans | 0.0 /100 | #290 | Tragic 82.9% |
| Pennsylvania Germans | 0.0 /100 | #291 | Tragic 82.9% |
| Immigrants | Latin America | 0.0 /100 | #292 | Tragic 82.8% |
| Spanish Americans | 0.0 /100 | #293 | Tragic 82.8% |
| Potawatomi | 0.0 /100 | #294 | Tragic 82.7% |
| Immigrants | Lebanon | 0.0 /100 | #295 | Tragic 82.7% |
| Mexican American Indians | 0.0 /100 | #296 | Tragic 82.6% |
| Hmong | 0.0 /100 | #297 | Tragic 82.6% |