Yaqui vs Russian In Labor Force | Age 16-19
COMPARE
Yaqui
Russian
In Labor Force | Age 16-19
In Labor Force | Age 16-19 Comparison
Yaqui
Russians
37.1%
IN LABOR FORCE | AGE 16-19
74.4/ 100
METRIC RATING
159th/ 347
METRIC RANK
36.7%
IN LABOR FORCE | AGE 16-19
57.5/ 100
METRIC RATING
173rd/ 347
METRIC RANK
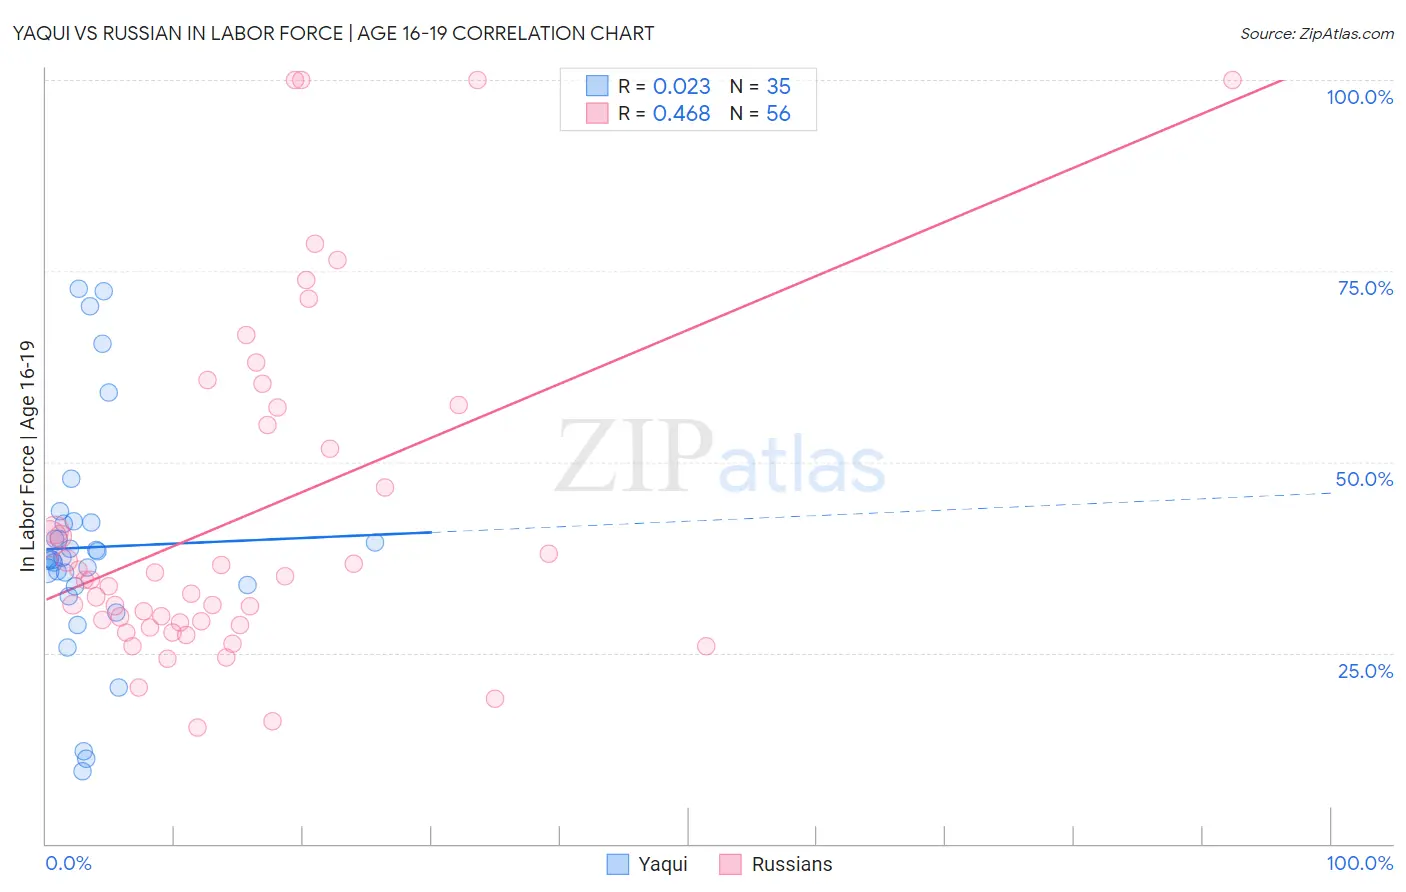
Yaqui vs Russian In Labor Force | Age 16-19 Correlation Chart
The statistical analysis conducted on geographies consisting of 107,656,749 people shows no correlation between the proportion of Yaqui and labor force participation rate among population between the ages 16 and 19 in the United States with a correlation coefficient (R) of 0.023 and weighted average of 37.1%. Similarly, the statistical analysis conducted on geographies consisting of 510,287,384 people shows a moderate positive correlation between the proportion of Russians and labor force participation rate among population between the ages 16 and 19 in the United States with a correlation coefficient (R) of 0.468 and weighted average of 36.7%, a difference of 0.96%.
In Labor Force | Age 16-19 Correlation Summary
| Measurement | Yaqui | Russian |
| Minimum | 9.5% | 15.3% |
| Maximum | 72.6% | 100.0% |
| Range | 63.1% | 84.7% |
| Mean | 38.8% | 42.9% |
| Median | 37.3% | 34.6% |
| Interquartile 25% (IQ1) | 33.7% | 28.8% |
| Interquartile 75% (IQ3) | 42.1% | 56.0% |
| Interquartile Range (IQR) | 8.4% | 27.2% |
| Standard Deviation (Sample) | 15.0% | 22.2% |
| Standard Deviation (Population) | 14.8% | 22.0% |
Demographics Similar to Yaqui and Russians by In Labor Force | Age 16-19
In terms of in labor force | age 16-19, the demographic groups most similar to Yaqui are Immigrants from Saudi Arabia (37.0%, a difference of 0.030%), Ute (37.1%, a difference of 0.080%), Immigrants from Brazil (37.1%, a difference of 0.14%), Cambodian (37.0%, a difference of 0.18%), and Immigrants from Jordan (36.9%, a difference of 0.31%). Similarly, the demographic groups most similar to Russians are Immigrants from Cambodia (36.7%, a difference of 0.040%), South African (36.7%, a difference of 0.040%), Immigrants from South Africa (36.8%, a difference of 0.15%), Immigrants from Latvia (36.8%, a difference of 0.21%), and Palestinian (36.8%, a difference of 0.29%).
| Demographics | Rating | Rank | In Labor Force | Age 16-19 |
| Kiowa | 80.4 /100 | #156 | Excellent 37.2% |
| Immigrants | Brazil | 76.5 /100 | #157 | Good 37.1% |
| Ute | 75.7 /100 | #158 | Good 37.1% |
| Yaqui | 74.4 /100 | #159 | Good 37.1% |
| Immigrants | Saudi Arabia | 73.9 /100 | #160 | Good 37.0% |
| Cambodians | 71.5 /100 | #161 | Good 37.0% |
| Immigrants | Jordan | 69.5 /100 | #162 | Good 36.9% |
| Bermudans | 69.3 /100 | #163 | Good 36.9% |
| Immigrants | Kuwait | 68.9 /100 | #164 | Good 36.9% |
| Yakama | 66.9 /100 | #165 | Good 36.9% |
| Immigrants | Western Africa | 66.7 /100 | #166 | Good 36.9% |
| Arabs | 63.6 /100 | #167 | Good 36.8% |
| Palestinians | 63.1 /100 | #168 | Good 36.8% |
| Immigrants | Latvia | 61.6 /100 | #169 | Good 36.8% |
| Immigrants | South Africa | 60.5 /100 | #170 | Good 36.8% |
| Immigrants | Cambodia | 58.4 /100 | #171 | Average 36.7% |
| South Africans | 58.3 /100 | #172 | Average 36.7% |
| Russians | 57.5 /100 | #173 | Average 36.7% |
| Immigrants | Czechoslovakia | 50.0 /100 | #174 | Average 36.6% |
| Natives/Alaskans | 49.0 /100 | #175 | Average 36.6% |
| Albanians | 48.8 /100 | #176 | Average 36.5% |