Yaqui vs Immigrants from Canada In Labor Force | Age 20-64
COMPARE
Yaqui
Immigrants from Canada
In Labor Force | Age 20-64
In Labor Force | Age 20-64 Comparison
Yaqui
Immigrants from Canada
76.5%
IN LABOR FORCE | AGE 20-64
0.0/ 100
METRIC RATING
316th/ 347
METRIC RANK
79.0%
IN LABOR FORCE | AGE 20-64
3.2/ 100
METRIC RATING
234th/ 347
METRIC RANK
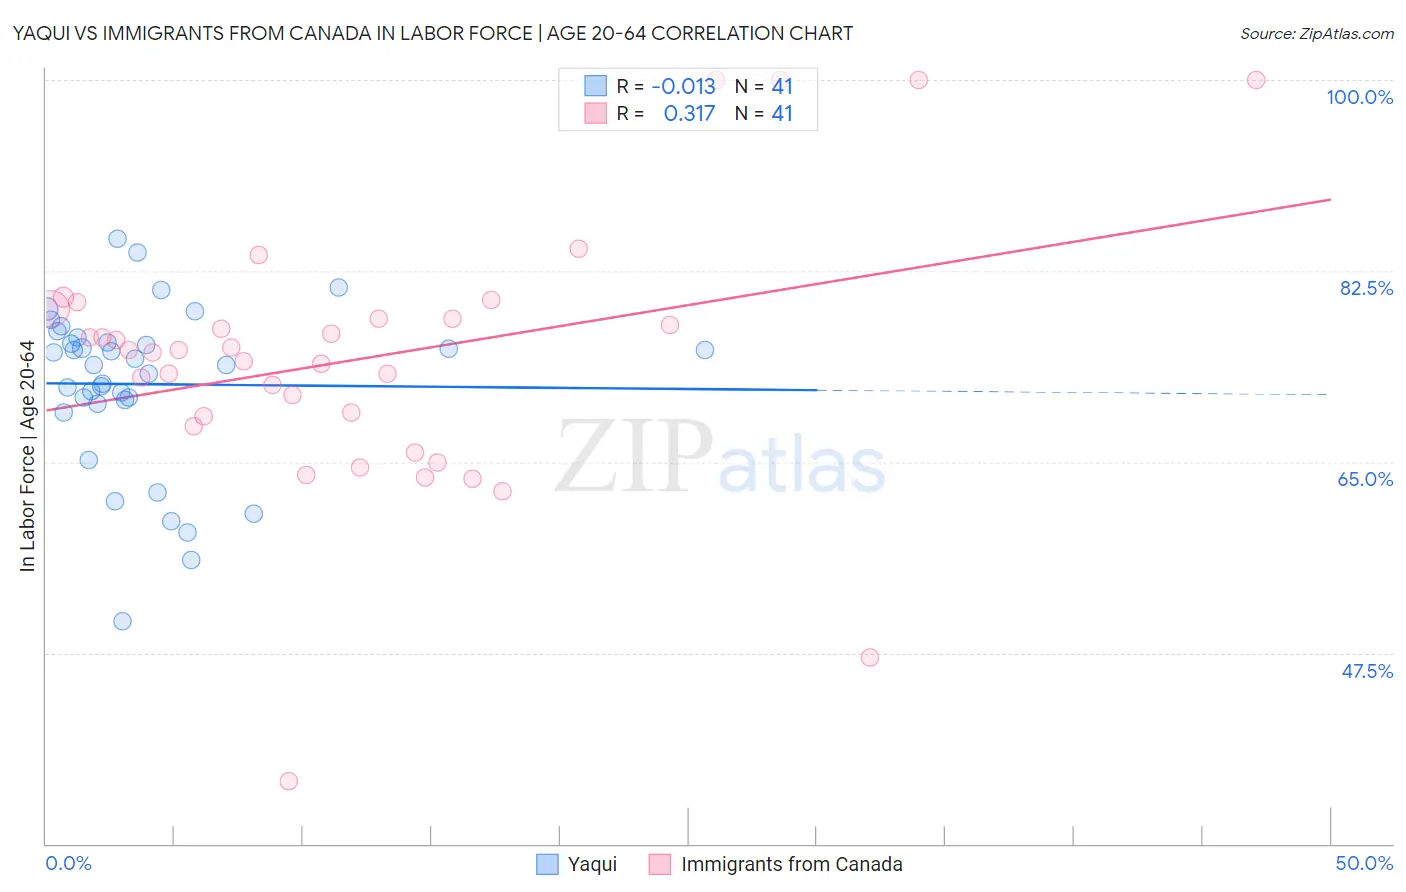
Yaqui vs Immigrants from Canada In Labor Force | Age 20-64 Correlation Chart
The statistical analysis conducted on geographies consisting of 107,721,250 people shows no correlation between the proportion of Yaqui and labor force participation rate among population between the ages 20 and 64 in the United States with a correlation coefficient (R) of -0.013 and weighted average of 76.5%. Similarly, the statistical analysis conducted on geographies consisting of 459,408,758 people shows a mild positive correlation between the proportion of Immigrants from Canada and labor force participation rate among population between the ages 20 and 64 in the United States with a correlation coefficient (R) of 0.317 and weighted average of 79.0%, a difference of 3.2%.
In Labor Force | Age 20-64 Correlation Summary
| Measurement | Yaqui | Immigrants from Canada |
| Minimum | 50.4% | 35.8% |
| Maximum | 85.4% | 100.0% |
| Range | 35.0% | 64.2% |
| Mean | 72.1% | 74.5% |
| Median | 73.9% | 75.3% |
| Interquartile 25% (IQ1) | 70.5% | 68.7% |
| Interquartile 75% (IQ3) | 76.2% | 78.6% |
| Interquartile Range (IQR) | 5.7% | 9.9% |
| Standard Deviation (Sample) | 7.5% | 12.3% |
| Standard Deviation (Population) | 7.5% | 12.2% |
Similar Demographics by In Labor Force | Age 20-64
Demographics Similar to Yaqui by In Labor Force | Age 20-64
In terms of in labor force | age 20-64, the demographic groups most similar to Yaqui are Ottawa (76.7%, a difference of 0.19%), Black/African American (76.8%, a difference of 0.29%), Shoshone (76.8%, a difference of 0.31%), Cherokee (76.2%, a difference of 0.40%), and Alaskan Athabascan (76.9%, a difference of 0.43%).
| Demographics | Rating | Rank | In Labor Force | Age 20-64 |
| Americans | 0.0 /100 | #309 | Tragic 77.0% |
| Comanche | 0.0 /100 | #310 | Tragic 77.0% |
| Blackfeet | 0.0 /100 | #311 | Tragic 77.0% |
| Alaskan Athabascans | 0.0 /100 | #312 | Tragic 76.9% |
| Shoshone | 0.0 /100 | #313 | Tragic 76.8% |
| Blacks/African Americans | 0.0 /100 | #314 | Tragic 76.8% |
| Ottawa | 0.0 /100 | #315 | Tragic 76.7% |
| Yaqui | 0.0 /100 | #316 | Tragic 76.5% |
| Cherokee | 0.0 /100 | #317 | Tragic 76.2% |
| Chickasaw | 0.0 /100 | #318 | Tragic 76.2% |
| Inupiat | 0.0 /100 | #319 | Tragic 76.1% |
| Yakama | 0.0 /100 | #320 | Tragic 75.8% |
| Seminole | 0.0 /100 | #321 | Tragic 75.5% |
| Dutch West Indians | 0.0 /100 | #322 | Tragic 75.5% |
| Cajuns | 0.0 /100 | #323 | Tragic 75.5% |
Demographics Similar to Immigrants from Canada by In Labor Force | Age 20-64
In terms of in labor force | age 20-64, the demographic groups most similar to Immigrants from Canada are Tlingit-Haida (79.0%, a difference of 0.0%), Samoan (79.0%, a difference of 0.020%), Immigrants from North America (79.0%, a difference of 0.020%), Japanese (79.1%, a difference of 0.040%), and Immigrants from Jamaica (79.0%, a difference of 0.050%).
| Demographics | Rating | Rank | In Labor Force | Age 20-64 |
| Immigrants | Western Europe | 5.9 /100 | #227 | Tragic 79.1% |
| Panamanians | 5.7 /100 | #228 | Tragic 79.1% |
| Alsatians | 5.7 /100 | #229 | Tragic 79.1% |
| Native Hawaiians | 5.6 /100 | #230 | Tragic 79.1% |
| Lebanese | 5.1 /100 | #231 | Tragic 79.1% |
| Guamanians/Chamorros | 4.5 /100 | #232 | Tragic 79.1% |
| Japanese | 4.0 /100 | #233 | Tragic 79.1% |
| Immigrants | Canada | 3.2 /100 | #234 | Tragic 79.0% |
| Tlingit-Haida | 3.2 /100 | #235 | Tragic 79.0% |
| Samoans | 2.9 /100 | #236 | Tragic 79.0% |
| Immigrants | North America | 2.9 /100 | #237 | Tragic 79.0% |
| Immigrants | Jamaica | 2.6 /100 | #238 | Tragic 79.0% |
| Welsh | 2.4 /100 | #239 | Tragic 79.0% |
| Trinidadians and Tobagonians | 2.3 /100 | #240 | Tragic 79.0% |
| Jamaicans | 2.0 /100 | #241 | Tragic 78.9% |