West Indian vs Immigrants from Ethiopia In Labor Force | Age 20-64
COMPARE
West Indian
Immigrants from Ethiopia
In Labor Force | Age 20-64
In Labor Force | Age 20-64 Comparison
West Indians
Immigrants from Ethiopia
78.3%
IN LABOR FORCE | AGE 20-64
0.0/ 100
METRIC RATING
268th/ 347
METRIC RANK
82.1%
IN LABOR FORCE | AGE 20-64
100.0/ 100
METRIC RATING
1st/ 347
METRIC RANK
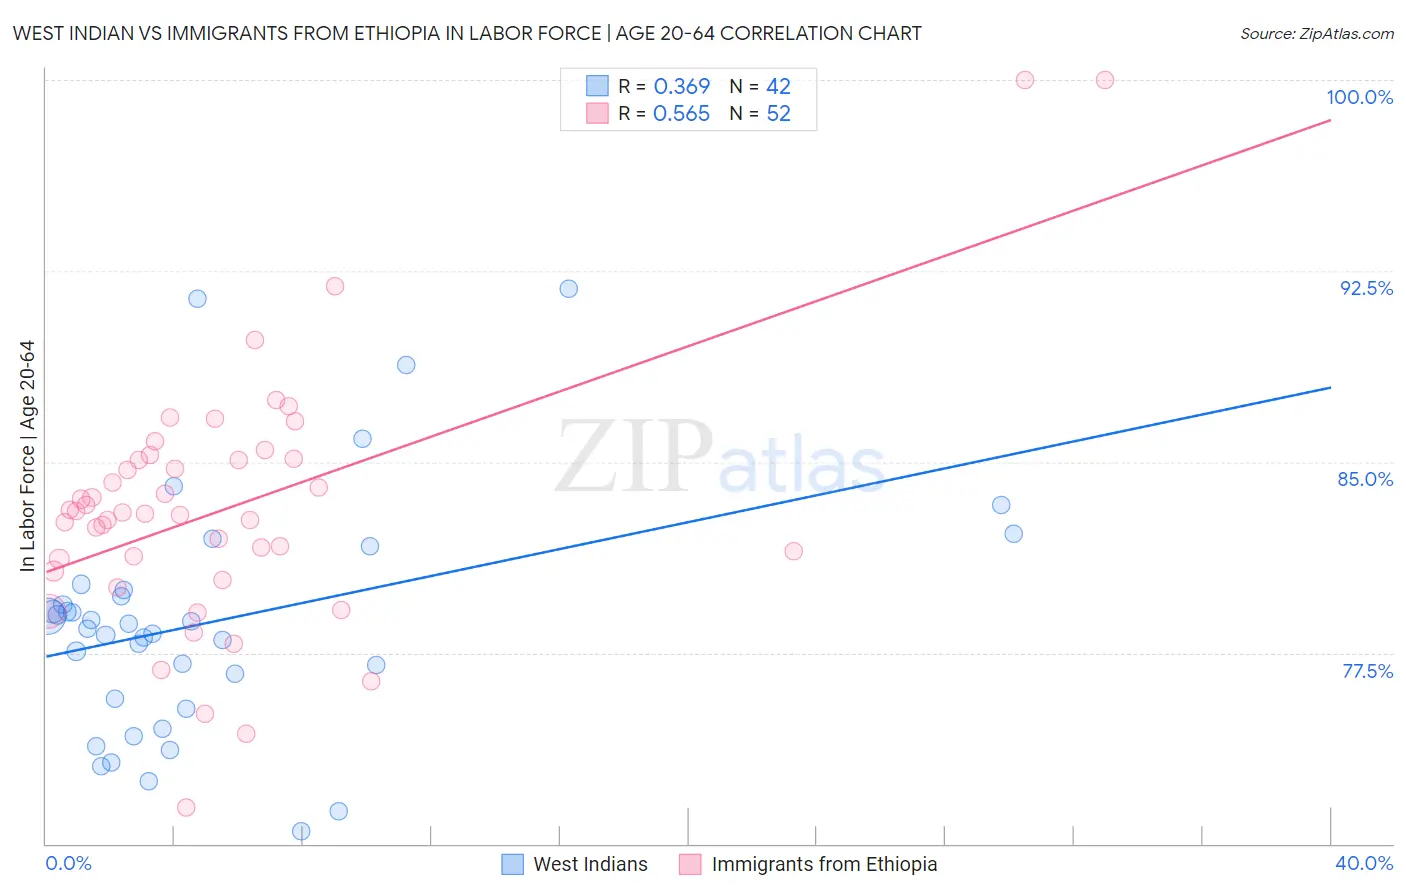
West Indian vs Immigrants from Ethiopia In Labor Force | Age 20-64 Correlation Chart
The statistical analysis conducted on geographies consisting of 254,049,696 people shows a mild positive correlation between the proportion of West Indians and labor force participation rate among population between the ages 20 and 64 in the United States with a correlation coefficient (R) of 0.369 and weighted average of 78.3%. Similarly, the statistical analysis conducted on geographies consisting of 211,573,899 people shows a substantial positive correlation between the proportion of Immigrants from Ethiopia and labor force participation rate among population between the ages 20 and 64 in the United States with a correlation coefficient (R) of 0.565 and weighted average of 82.1%, a difference of 4.7%.
In Labor Force | Age 20-64 Correlation Summary
| Measurement | West Indian | Immigrants from Ethiopia |
| Minimum | 70.5% | 71.4% |
| Maximum | 91.8% | 100.0% |
| Range | 21.3% | 28.6% |
| Mean | 78.7% | 83.2% |
| Median | 78.6% | 83.0% |
| Interquartile 25% (IQ1) | 75.7% | 81.0% |
| Interquartile 75% (IQ3) | 80.0% | 85.1% |
| Interquartile Range (IQR) | 4.3% | 4.1% |
| Standard Deviation (Sample) | 4.7% | 5.1% |
| Standard Deviation (Population) | 4.7% | 5.0% |
Similar Demographics by In Labor Force | Age 20-64
Demographics Similar to West Indians by In Labor Force | Age 20-64
In terms of in labor force | age 20-64, the demographic groups most similar to West Indians are U.S. Virgin Islander (78.4%, a difference of 0.020%), Bahamian (78.4%, a difference of 0.040%), British West Indian (78.4%, a difference of 0.050%), Immigrants from Barbados (78.3%, a difference of 0.050%), and Scotch-Irish (78.3%, a difference of 0.080%).
| Demographics | Rating | Rank | In Labor Force | Age 20-64 |
| Whites/Caucasians | 0.2 /100 | #261 | Tragic 78.5% |
| Fijians | 0.1 /100 | #262 | Tragic 78.4% |
| Pennsylvania Germans | 0.1 /100 | #263 | Tragic 78.4% |
| Spaniards | 0.1 /100 | #264 | Tragic 78.4% |
| British West Indians | 0.1 /100 | #265 | Tragic 78.4% |
| Bahamians | 0.1 /100 | #266 | Tragic 78.4% |
| U.S. Virgin Islanders | 0.1 /100 | #267 | Tragic 78.4% |
| West Indians | 0.0 /100 | #268 | Tragic 78.3% |
| Immigrants | Barbados | 0.0 /100 | #269 | Tragic 78.3% |
| Scotch-Irish | 0.0 /100 | #270 | Tragic 78.3% |
| Immigrants | Latin America | 0.0 /100 | #271 | Tragic 78.3% |
| Marshallese | 0.0 /100 | #272 | Tragic 78.3% |
| French American Indians | 0.0 /100 | #273 | Tragic 78.2% |
| Aleuts | 0.0 /100 | #274 | Tragic 78.2% |
| Spanish | 0.0 /100 | #275 | Tragic 78.2% |
Demographics Similar to Immigrants from Ethiopia by In Labor Force | Age 20-64
In terms of in labor force | age 20-64, the demographic groups most similar to Immigrants from Ethiopia are Ethiopian (82.0%, a difference of 0.12%), Immigrants from Bolivia (81.9%, a difference of 0.13%), Luxembourger (81.9%, a difference of 0.25%), Bolivian (81.7%, a difference of 0.45%), and Somali (81.6%, a difference of 0.56%).
| Demographics | Rating | Rank | In Labor Force | Age 20-64 |
| Immigrants | Ethiopia | 100.0 /100 | #1 | Exceptional 82.1% |
| Ethiopians | 100.0 /100 | #2 | Exceptional 82.0% |
| Immigrants | Bolivia | 100.0 /100 | #3 | Exceptional 81.9% |
| Luxembourgers | 100.0 /100 | #4 | Exceptional 81.9% |
| Bolivians | 100.0 /100 | #5 | Exceptional 81.7% |
| Somalis | 100.0 /100 | #6 | Exceptional 81.6% |
| Immigrants | Cameroon | 100.0 /100 | #7 | Exceptional 81.6% |
| Immigrants | Somalia | 100.0 /100 | #8 | Exceptional 81.6% |
| Sierra Leoneans | 100.0 /100 | #9 | Exceptional 81.5% |
| Immigrants | Sierra Leone | 100.0 /100 | #10 | Exceptional 81.5% |
| Immigrants | Eastern Africa | 100.0 /100 | #11 | Exceptional 81.3% |
| Immigrants | Eritrea | 100.0 /100 | #12 | Exceptional 81.3% |
| Immigrants | India | 100.0 /100 | #13 | Exceptional 81.3% |
| Cambodians | 100.0 /100 | #14 | Exceptional 81.1% |
| Bulgarians | 100.0 /100 | #15 | Exceptional 81.1% |