West Indian vs Ecuadorian In Labor Force | Age 20-64
COMPARE
West Indian
Ecuadorian
In Labor Force | Age 20-64
In Labor Force | Age 20-64 Comparison
West Indians
Ecuadorians
78.3%
IN LABOR FORCE | AGE 20-64
0.0/ 100
METRIC RATING
268th/ 347
METRIC RANK
79.4%
IN LABOR FORCE | AGE 20-64
23.1/ 100
METRIC RATING
196th/ 347
METRIC RANK
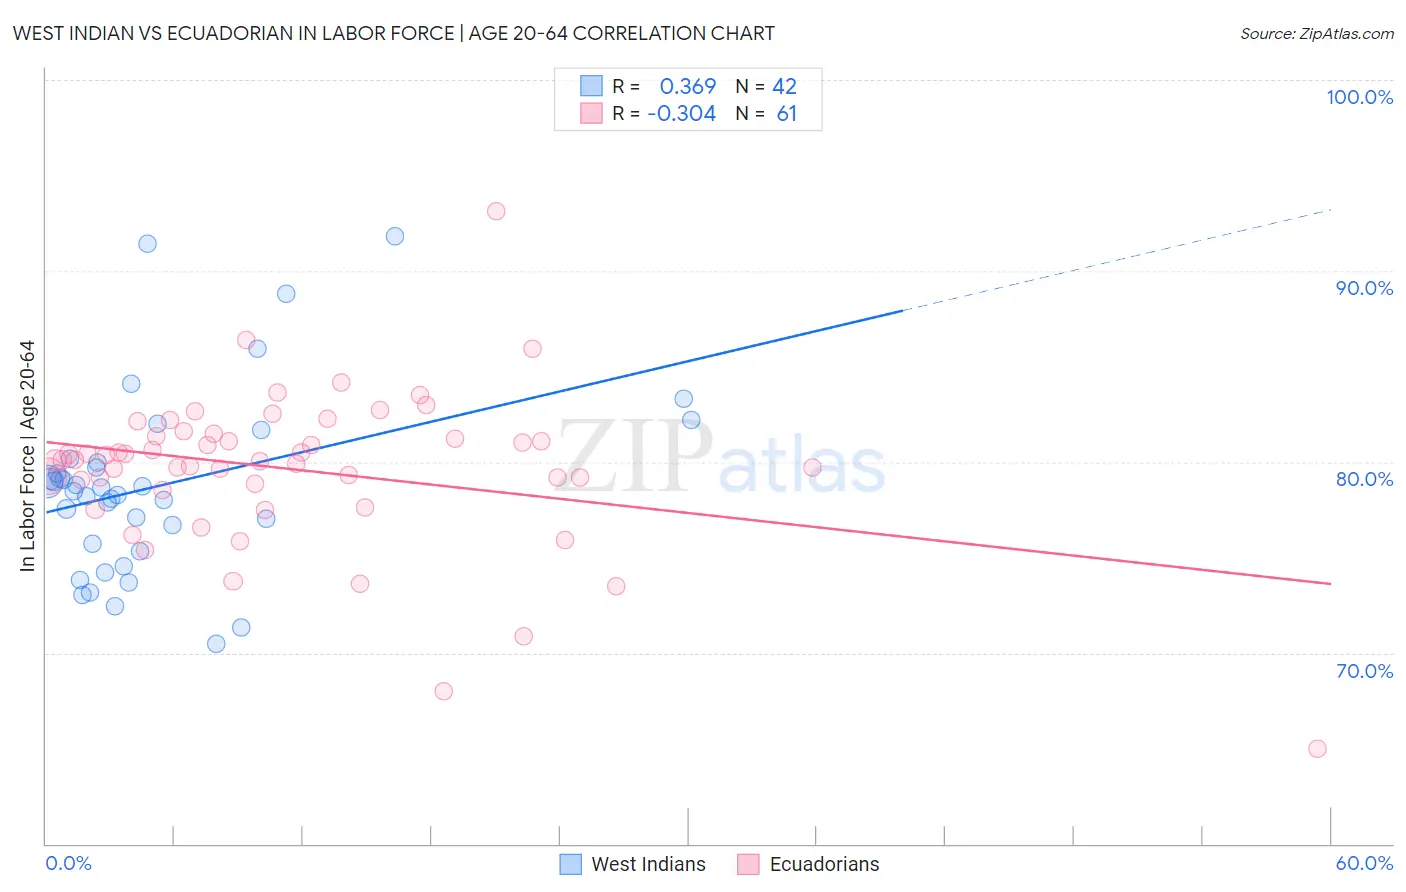
West Indian vs Ecuadorian In Labor Force | Age 20-64 Correlation Chart
The statistical analysis conducted on geographies consisting of 254,049,696 people shows a mild positive correlation between the proportion of West Indians and labor force participation rate among population between the ages 20 and 64 in the United States with a correlation coefficient (R) of 0.369 and weighted average of 78.3%. Similarly, the statistical analysis conducted on geographies consisting of 317,839,465 people shows a mild negative correlation between the proportion of Ecuadorians and labor force participation rate among population between the ages 20 and 64 in the United States with a correlation coefficient (R) of -0.304 and weighted average of 79.4%, a difference of 1.3%.
In Labor Force | Age 20-64 Correlation Summary
| Measurement | West Indian | Ecuadorian |
| Minimum | 70.5% | 65.0% |
| Maximum | 91.8% | 93.1% |
| Range | 21.3% | 28.1% |
| Mean | 78.7% | 79.6% |
| Median | 78.6% | 80.1% |
| Interquartile 25% (IQ1) | 75.7% | 78.7% |
| Interquartile 75% (IQ3) | 80.0% | 81.4% |
| Interquartile Range (IQR) | 4.3% | 2.7% |
| Standard Deviation (Sample) | 4.7% | 4.1% |
| Standard Deviation (Population) | 4.7% | 4.1% |
Similar Demographics by In Labor Force | Age 20-64
Demographics Similar to West Indians by In Labor Force | Age 20-64
In terms of in labor force | age 20-64, the demographic groups most similar to West Indians are U.S. Virgin Islander (78.4%, a difference of 0.020%), Bahamian (78.4%, a difference of 0.040%), British West Indian (78.4%, a difference of 0.050%), Immigrants from Barbados (78.3%, a difference of 0.050%), and Scotch-Irish (78.3%, a difference of 0.080%).
| Demographics | Rating | Rank | In Labor Force | Age 20-64 |
| Whites/Caucasians | 0.2 /100 | #261 | Tragic 78.5% |
| Fijians | 0.1 /100 | #262 | Tragic 78.4% |
| Pennsylvania Germans | 0.1 /100 | #263 | Tragic 78.4% |
| Spaniards | 0.1 /100 | #264 | Tragic 78.4% |
| British West Indians | 0.1 /100 | #265 | Tragic 78.4% |
| Bahamians | 0.1 /100 | #266 | Tragic 78.4% |
| U.S. Virgin Islanders | 0.1 /100 | #267 | Tragic 78.4% |
| West Indians | 0.0 /100 | #268 | Tragic 78.3% |
| Immigrants | Barbados | 0.0 /100 | #269 | Tragic 78.3% |
| Scotch-Irish | 0.0 /100 | #270 | Tragic 78.3% |
| Immigrants | Latin America | 0.0 /100 | #271 | Tragic 78.3% |
| Marshallese | 0.0 /100 | #272 | Tragic 78.3% |
| French American Indians | 0.0 /100 | #273 | Tragic 78.2% |
| Aleuts | 0.0 /100 | #274 | Tragic 78.2% |
| Spanish | 0.0 /100 | #275 | Tragic 78.2% |
Demographics Similar to Ecuadorians by In Labor Force | Age 20-64
In terms of in labor force | age 20-64, the demographic groups most similar to Ecuadorians are Immigrants from Austria (79.4%, a difference of 0.010%), Immigrants from Senegal (79.4%, a difference of 0.010%), Immigrants from Thailand (79.4%, a difference of 0.020%), Immigrants from Laos (79.4%, a difference of 0.020%), and Indonesian (79.4%, a difference of 0.030%).
| Demographics | Rating | Rank | In Labor Force | Age 20-64 |
| Immigrants | El Salvador | 30.9 /100 | #189 | Fair 79.4% |
| Immigrants | Syria | 30.8 /100 | #190 | Fair 79.4% |
| Swiss | 28.9 /100 | #191 | Fair 79.4% |
| Immigrants | Denmark | 26.9 /100 | #192 | Fair 79.4% |
| Indonesians | 26.1 /100 | #193 | Fair 79.4% |
| Immigrants | Thailand | 24.8 /100 | #194 | Fair 79.4% |
| Immigrants | Austria | 23.7 /100 | #195 | Fair 79.4% |
| Ecuadorians | 23.1 /100 | #196 | Fair 79.4% |
| Immigrants | Senegal | 22.5 /100 | #197 | Fair 79.4% |
| Immigrants | Laos | 21.5 /100 | #198 | Fair 79.4% |
| Dutch | 20.2 /100 | #199 | Fair 79.3% |
| Immigrants | Oceania | 19.1 /100 | #200 | Poor 79.3% |
| Immigrants | Nicaragua | 19.0 /100 | #201 | Poor 79.3% |
| Nicaraguans | 18.3 /100 | #202 | Poor 79.3% |
| Iraqis | 17.7 /100 | #203 | Poor 79.3% |