West Indian vs Immigrants from Ethiopia College, 1 year or more
COMPARE
West Indian
Immigrants from Ethiopia
College, 1 year or more
College, 1 year or more Comparison
West Indians
Immigrants from Ethiopia
56.3%
COLLEGE, 1 YEAR OR MORE
1.8/ 100
METRIC RATING
235th/ 347
METRIC RANK
62.6%
COLLEGE, 1 YEAR OR MORE
98.2/ 100
METRIC RATING
89th/ 347
METRIC RANK
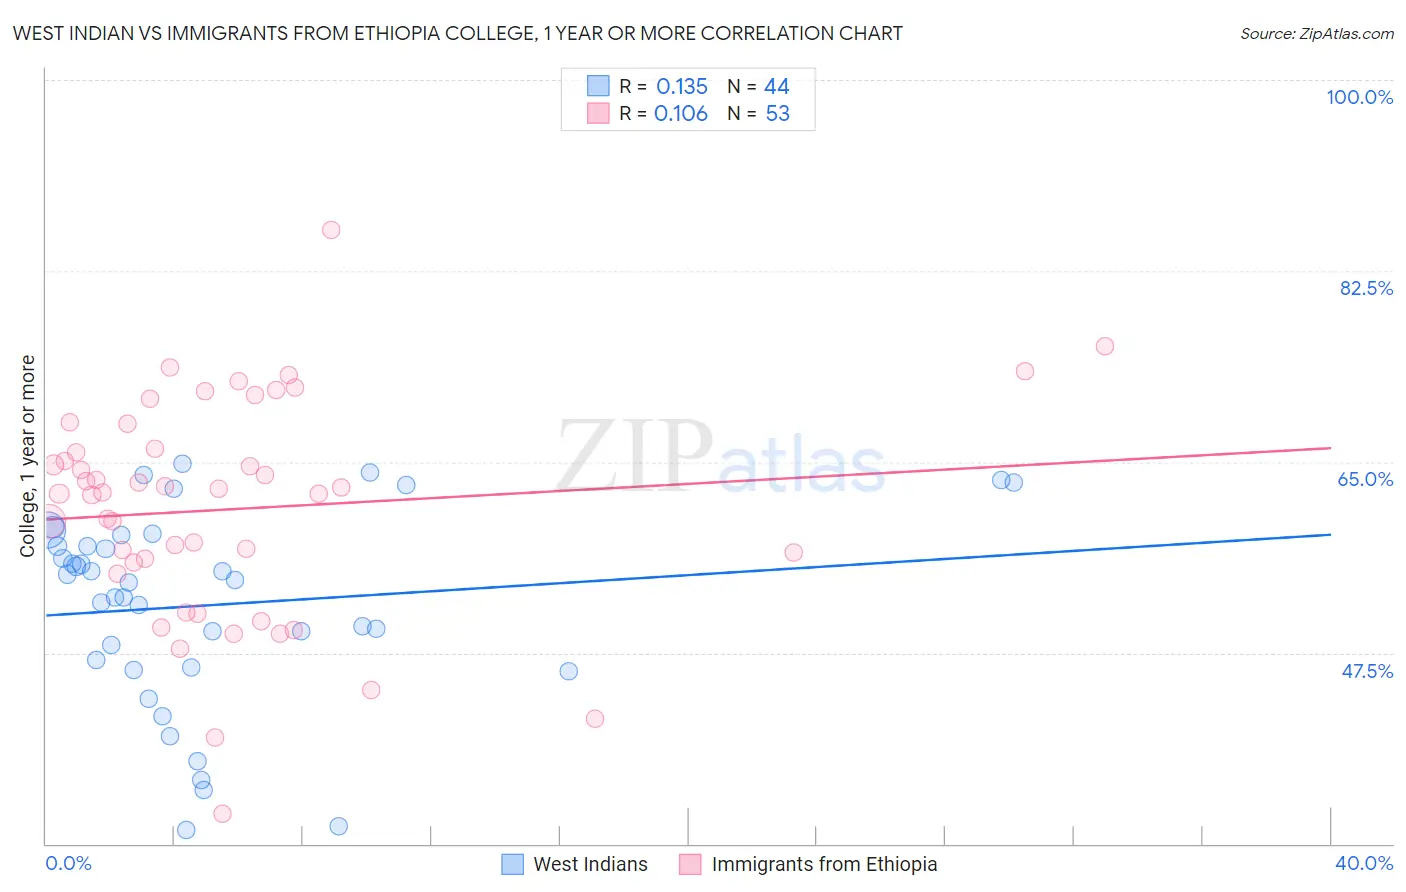
West Indian vs Immigrants from Ethiopia College, 1 year or more Correlation Chart
The statistical analysis conducted on geographies consisting of 254,063,654 people shows a poor positive correlation between the proportion of West Indians and percentage of population with at least college, 1 year or more education in the United States with a correlation coefficient (R) of 0.135 and weighted average of 56.3%. Similarly, the statistical analysis conducted on geographies consisting of 211,551,397 people shows a poor positive correlation between the proportion of Immigrants from Ethiopia and percentage of population with at least college, 1 year or more education in the United States with a correlation coefficient (R) of 0.106 and weighted average of 62.6%, a difference of 11.2%.
College, 1 year or more Correlation Summary
| Measurement | West Indian | Immigrants from Ethiopia |
| Minimum | 31.2% | 32.7% |
| Maximum | 64.8% | 86.2% |
| Range | 33.6% | 53.5% |
| Mean | 51.9% | 60.7% |
| Median | 54.1% | 62.2% |
| Interquartile 25% (IQ1) | 46.5% | 55.3% |
| Interquartile 75% (IQ3) | 57.8% | 67.3% |
| Interquartile Range (IQR) | 11.3% | 12.0% |
| Standard Deviation (Sample) | 8.9% | 10.1% |
| Standard Deviation (Population) | 8.8% | 10.0% |
Similar Demographics by College, 1 year or more
Demographics Similar to West Indians by College, 1 year or more
In terms of college, 1 year or more, the demographic groups most similar to West Indians are Spanish American (56.3%, a difference of 0.0%), Iroquois (56.2%, a difference of 0.050%), Samoan (56.2%, a difference of 0.16%), Barbadian (56.0%, a difference of 0.43%), and Nonimmigrants (56.5%, a difference of 0.45%).
| Demographics | Rating | Rank | College, 1 year or more |
| Immigrants | Fiji | 4.0 /100 | #228 | Tragic 56.9% |
| Cree | 3.6 /100 | #229 | Tragic 56.8% |
| Liberians | 3.1 /100 | #230 | Tragic 56.7% |
| Immigrants | Burma/Myanmar | 2.7 /100 | #231 | Tragic 56.6% |
| Immigrants | Bangladesh | 2.6 /100 | #232 | Tragic 56.6% |
| Immigrants | Nonimmigrants | 2.5 /100 | #233 | Tragic 56.5% |
| Spanish Americans | 1.8 /100 | #234 | Tragic 56.3% |
| West Indians | 1.8 /100 | #235 | Tragic 56.3% |
| Iroquois | 1.7 /100 | #236 | Tragic 56.2% |
| Samoans | 1.6 /100 | #237 | Tragic 56.2% |
| Barbadians | 1.3 /100 | #238 | Tragic 56.0% |
| Puget Sound Salish | 1.1 /100 | #239 | Tragic 55.9% |
| Trinidadians and Tobagonians | 1.1 /100 | #240 | Tragic 55.8% |
| French American Indians | 1.0 /100 | #241 | Tragic 55.8% |
| Marshallese | 1.0 /100 | #242 | Tragic 55.8% |
Demographics Similar to Immigrants from Ethiopia by College, 1 year or more
In terms of college, 1 year or more, the demographic groups most similar to Immigrants from Ethiopia are Greek (62.6%, a difference of 0.10%), Immigrants from Western Asia (62.5%, a difference of 0.17%), Immigrants from Hungary (62.7%, a difference of 0.27%), Immigrants from Eastern Europe (62.4%, a difference of 0.28%), and Immigrants from Western Europe (62.7%, a difference of 0.29%).
| Demographics | Rating | Rank | College, 1 year or more |
| Immigrants | Bolivia | 98.7 /100 | #82 | Exceptional 62.8% |
| Immigrants | Argentina | 98.6 /100 | #83 | Exceptional 62.8% |
| Immigrants | England | 98.6 /100 | #84 | Exceptional 62.8% |
| Immigrants | Pakistan | 98.6 /100 | #85 | Exceptional 62.8% |
| Immigrants | Western Europe | 98.6 /100 | #86 | Exceptional 62.7% |
| Immigrants | Hungary | 98.6 /100 | #87 | Exceptional 62.7% |
| Greeks | 98.3 /100 | #88 | Exceptional 62.6% |
| Immigrants | Ethiopia | 98.2 /100 | #89 | Exceptional 62.6% |
| Immigrants | Western Asia | 97.9 /100 | #90 | Exceptional 62.5% |
| Immigrants | Eastern Europe | 97.8 /100 | #91 | Exceptional 62.4% |
| Immigrants | Egypt | 97.8 /100 | #92 | Exceptional 62.4% |
| Romanians | 97.7 /100 | #93 | Exceptional 62.4% |
| Immigrants | Croatia | 97.6 /100 | #94 | Exceptional 62.3% |
| British | 97.4 /100 | #95 | Exceptional 62.3% |
| Chinese | 97.2 /100 | #96 | Exceptional 62.2% |