Immigrants from Israel vs Immigrants from Ethiopia In Labor Force | Age 20-64
COMPARE
Immigrants from Israel
Immigrants from Ethiopia
In Labor Force | Age 20-64
In Labor Force | Age 20-64 Comparison
Immigrants from Israel
Immigrants from Ethiopia
79.8%
IN LABOR FORCE | AGE 20-64
80.0/ 100
METRIC RATING
141st/ 347
METRIC RANK
82.1%
IN LABOR FORCE | AGE 20-64
100.0/ 100
METRIC RATING
1st/ 347
METRIC RANK
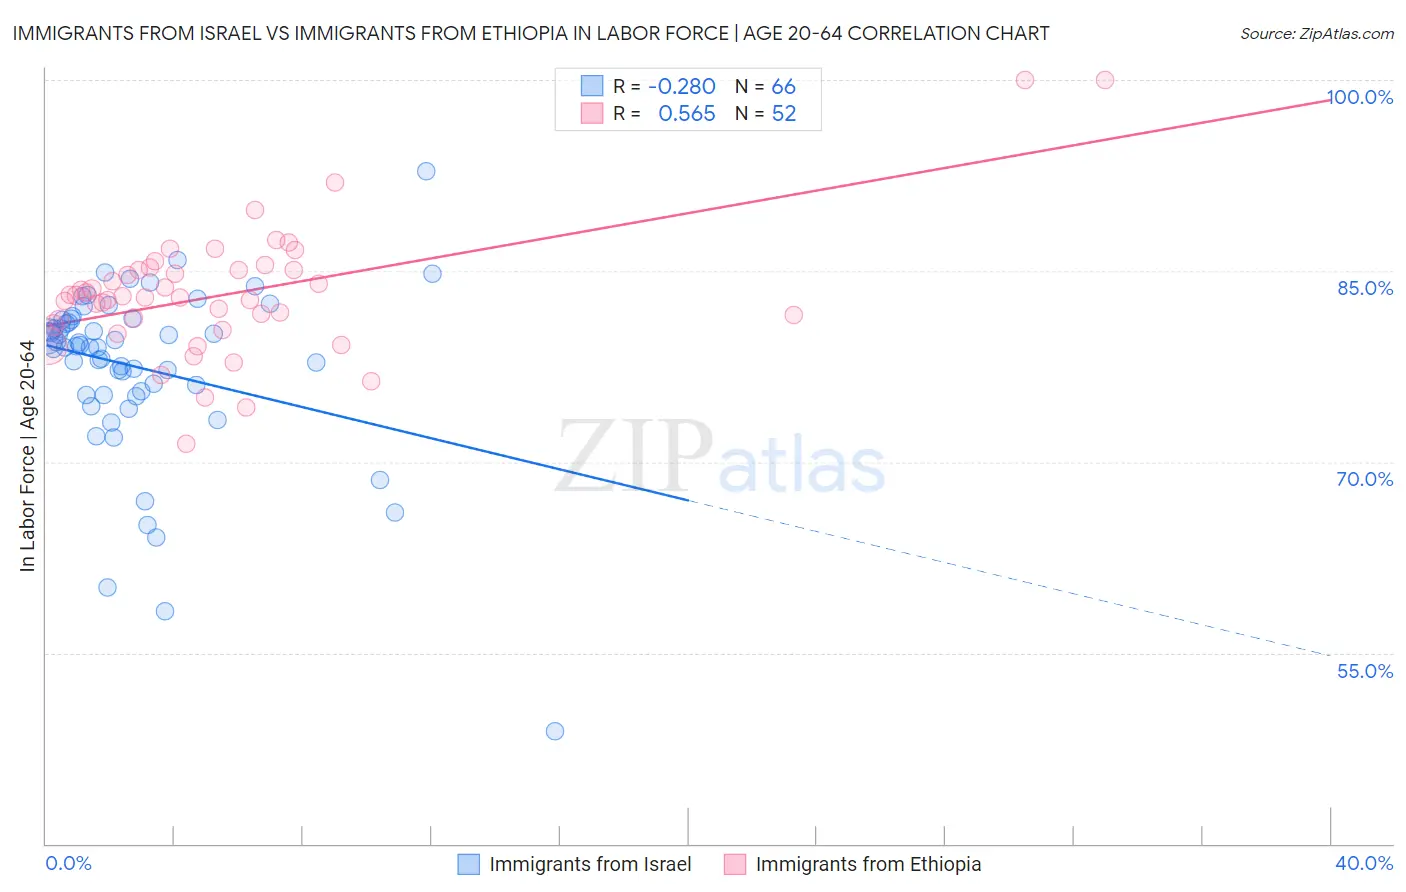
Immigrants from Israel vs Immigrants from Ethiopia In Labor Force | Age 20-64 Correlation Chart
The statistical analysis conducted on geographies consisting of 210,029,528 people shows a weak negative correlation between the proportion of Immigrants from Israel and labor force participation rate among population between the ages 20 and 64 in the United States with a correlation coefficient (R) of -0.280 and weighted average of 79.8%. Similarly, the statistical analysis conducted on geographies consisting of 211,573,899 people shows a substantial positive correlation between the proportion of Immigrants from Ethiopia and labor force participation rate among population between the ages 20 and 64 in the United States with a correlation coefficient (R) of 0.565 and weighted average of 82.1%, a difference of 2.9%.
In Labor Force | Age 20-64 Correlation Summary
| Measurement | Immigrants from Israel | Immigrants from Ethiopia |
| Minimum | 48.8% | 71.4% |
| Maximum | 92.8% | 100.0% |
| Range | 44.0% | 28.6% |
| Mean | 77.4% | 83.2% |
| Median | 79.1% | 83.0% |
| Interquartile 25% (IQ1) | 75.3% | 81.0% |
| Interquartile 75% (IQ3) | 81.2% | 85.1% |
| Interquartile Range (IQR) | 5.9% | 4.1% |
| Standard Deviation (Sample) | 7.0% | 5.1% |
| Standard Deviation (Population) | 6.9% | 5.0% |
Similar Demographics by In Labor Force | Age 20-64
Demographics Similar to Immigrants from Israel by In Labor Force | Age 20-64
In terms of in labor force | age 20-64, the demographic groups most similar to Immigrants from Israel are Immigrants from South Eastern Asia (79.8%, a difference of 0.0%), Slovak (79.8%, a difference of 0.0%), Immigrants from Sweden (79.8%, a difference of 0.0%), Korean (79.8%, a difference of 0.0%), and Pakistani (79.8%, a difference of 0.010%).
| Demographics | Rating | Rank | In Labor Force | Age 20-64 |
| Belgians | 87.4 /100 | #134 | Excellent 79.9% |
| Ukrainians | 86.8 /100 | #135 | Excellent 79.9% |
| Immigrants | Singapore | 86.7 /100 | #136 | Excellent 79.9% |
| Immigrants | Ukraine | 86.5 /100 | #137 | Excellent 79.9% |
| Immigrants | Nigeria | 86.4 /100 | #138 | Excellent 79.9% |
| Immigrants | Spain | 83.9 /100 | #139 | Excellent 79.8% |
| Immigrants | South Eastern Asia | 80.4 /100 | #140 | Excellent 79.8% |
| Immigrants | Israel | 80.0 /100 | #141 | Good 79.8% |
| Slovaks | 79.9 /100 | #142 | Good 79.8% |
| Immigrants | Sweden | 79.7 /100 | #143 | Good 79.8% |
| Koreans | 79.6 /100 | #144 | Good 79.8% |
| Pakistanis | 79.3 /100 | #145 | Good 79.8% |
| Immigrants | Southern Europe | 78.9 /100 | #146 | Good 79.8% |
| Immigrants | Philippines | 78.0 /100 | #147 | Good 79.8% |
| Romanians | 77.6 /100 | #148 | Good 79.8% |
Demographics Similar to Immigrants from Ethiopia by In Labor Force | Age 20-64
In terms of in labor force | age 20-64, the demographic groups most similar to Immigrants from Ethiopia are Ethiopian (82.0%, a difference of 0.12%), Immigrants from Bolivia (81.9%, a difference of 0.13%), Luxembourger (81.9%, a difference of 0.25%), Bolivian (81.7%, a difference of 0.45%), and Somali (81.6%, a difference of 0.56%).
| Demographics | Rating | Rank | In Labor Force | Age 20-64 |
| Immigrants | Ethiopia | 100.0 /100 | #1 | Exceptional 82.1% |
| Ethiopians | 100.0 /100 | #2 | Exceptional 82.0% |
| Immigrants | Bolivia | 100.0 /100 | #3 | Exceptional 81.9% |
| Luxembourgers | 100.0 /100 | #4 | Exceptional 81.9% |
| Bolivians | 100.0 /100 | #5 | Exceptional 81.7% |
| Somalis | 100.0 /100 | #6 | Exceptional 81.6% |
| Immigrants | Cameroon | 100.0 /100 | #7 | Exceptional 81.6% |
| Immigrants | Somalia | 100.0 /100 | #8 | Exceptional 81.6% |
| Sierra Leoneans | 100.0 /100 | #9 | Exceptional 81.5% |
| Immigrants | Sierra Leone | 100.0 /100 | #10 | Exceptional 81.5% |
| Immigrants | Eastern Africa | 100.0 /100 | #11 | Exceptional 81.3% |
| Immigrants | Eritrea | 100.0 /100 | #12 | Exceptional 81.3% |
| Immigrants | India | 100.0 /100 | #13 | Exceptional 81.3% |
| Cambodians | 100.0 /100 | #14 | Exceptional 81.1% |
| Bulgarians | 100.0 /100 | #15 | Exceptional 81.1% |