Vietnamese vs West Indian In Labor Force | Age 35-44
COMPARE
Vietnamese
West Indian
In Labor Force | Age 35-44
In Labor Force | Age 35-44 Comparison
Vietnamese
West Indians
83.5%
IN LABOR FORCE | AGE 35-44
0.2/ 100
METRIC RATING
260th/ 347
METRIC RANK
83.9%
IN LABOR FORCE | AGE 35-44
2.4/ 100
METRIC RATING
236th/ 347
METRIC RANK
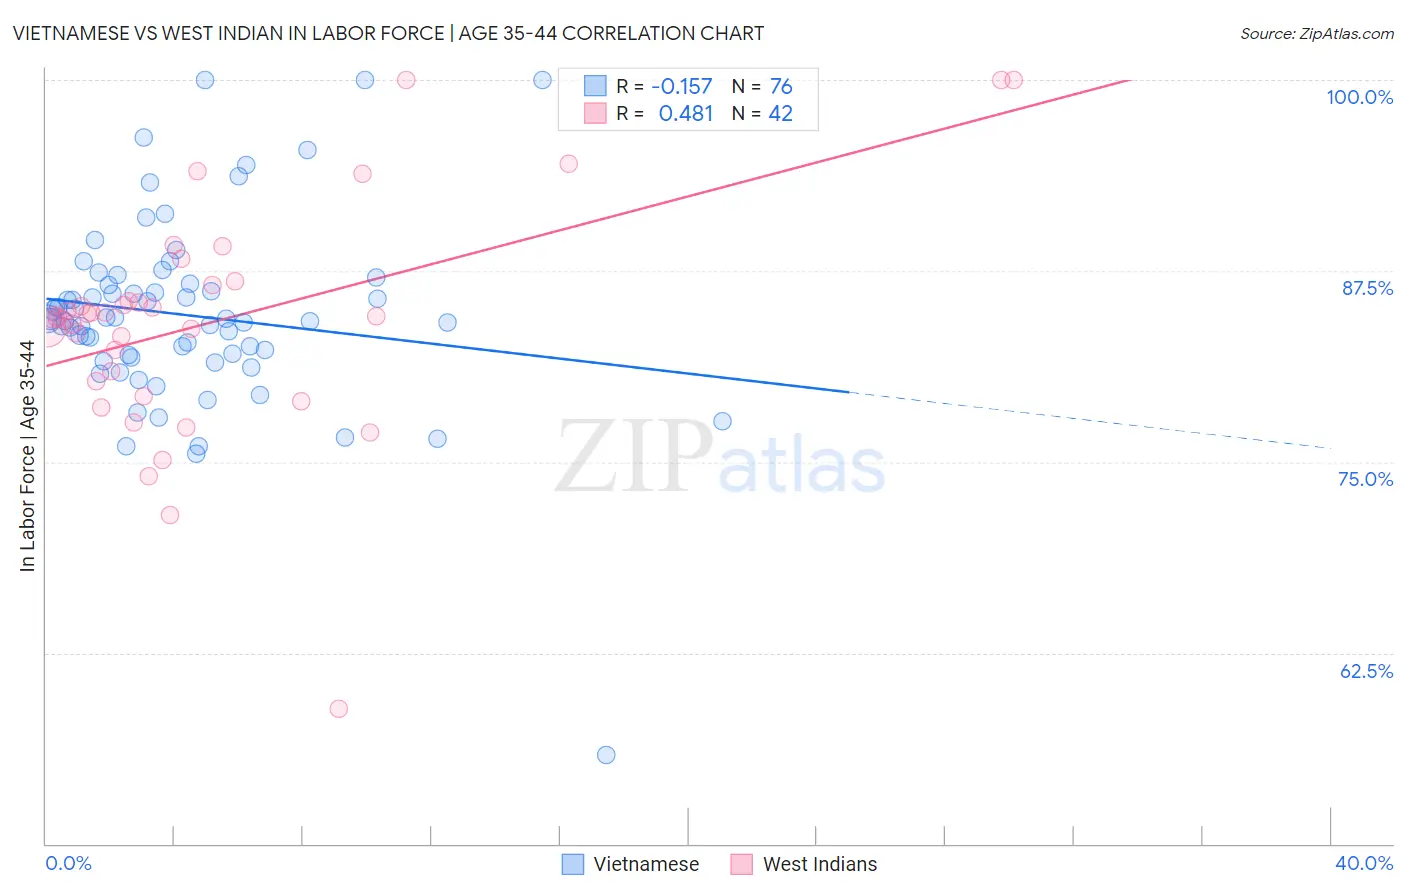
Vietnamese vs West Indian In Labor Force | Age 35-44 Correlation Chart
The statistical analysis conducted on geographies consisting of 170,595,548 people shows a poor negative correlation between the proportion of Vietnamese and labor force participation rate among population between the ages 35 and 44 in the United States with a correlation coefficient (R) of -0.157 and weighted average of 83.5%. Similarly, the statistical analysis conducted on geographies consisting of 253,906,051 people shows a moderate positive correlation between the proportion of West Indians and labor force participation rate among population between the ages 35 and 44 in the United States with a correlation coefficient (R) of 0.481 and weighted average of 83.9%, a difference of 0.41%.
In Labor Force | Age 35-44 Correlation Summary
| Measurement | Vietnamese | West Indian |
| Minimum | 55.8% | 58.8% |
| Maximum | 100.0% | 100.0% |
| Range | 44.2% | 41.2% |
| Mean | 84.6% | 84.2% |
| Median | 84.4% | 84.5% |
| Interquartile 25% (IQ1) | 81.9% | 80.3% |
| Interquartile 75% (IQ3) | 86.6% | 86.6% |
| Interquartile Range (IQR) | 4.7% | 6.3% |
| Standard Deviation (Sample) | 6.3% | 7.6% |
| Standard Deviation (Population) | 6.2% | 7.5% |
Similar Demographics by In Labor Force | Age 35-44
Demographics Similar to Vietnamese by In Labor Force | Age 35-44
In terms of in labor force | age 35-44, the demographic groups most similar to Vietnamese are Immigrants from Dominica (83.5%, a difference of 0.0%), Immigrants from El Salvador (83.5%, a difference of 0.010%), Immigrants from Congo (83.5%, a difference of 0.010%), Tsimshian (83.5%, a difference of 0.030%), and Iroquois (83.5%, a difference of 0.040%).
| Demographics | Rating | Rank | In Labor Force | Age 35-44 |
| Lebanese | 0.4 /100 | #253 | Tragic 83.6% |
| Tongans | 0.4 /100 | #254 | Tragic 83.6% |
| Immigrants | Azores | 0.3 /100 | #255 | Tragic 83.6% |
| Japanese | 0.3 /100 | #256 | Tragic 83.6% |
| Basques | 0.3 /100 | #257 | Tragic 83.6% |
| Tsimshian | 0.2 /100 | #258 | Tragic 83.5% |
| Immigrants | El Salvador | 0.2 /100 | #259 | Tragic 83.5% |
| Vietnamese | 0.2 /100 | #260 | Tragic 83.5% |
| Immigrants | Dominica | 0.2 /100 | #261 | Tragic 83.5% |
| Immigrants | Congo | 0.2 /100 | #262 | Tragic 83.5% |
| Iroquois | 0.2 /100 | #263 | Tragic 83.5% |
| Scotch-Irish | 0.1 /100 | #264 | Tragic 83.5% |
| Central Americans | 0.1 /100 | #265 | Tragic 83.5% |
| Spaniards | 0.1 /100 | #266 | Tragic 83.4% |
| Guamanians/Chamorros | 0.1 /100 | #267 | Tragic 83.4% |
Demographics Similar to West Indians by In Labor Force | Age 35-44
In terms of in labor force | age 35-44, the demographic groups most similar to West Indians are Immigrants from Syria (83.9%, a difference of 0.0%), Immigrants from Oceania (83.9%, a difference of 0.020%), Immigrants from Germany (83.9%, a difference of 0.030%), Native Hawaiian (83.9%, a difference of 0.040%), and English (83.8%, a difference of 0.040%).
| Demographics | Rating | Rank | In Labor Force | Age 35-44 |
| Immigrants | Thailand | 4.7 /100 | #229 | Tragic 84.0% |
| Immigrants | Iraq | 3.7 /100 | #230 | Tragic 83.9% |
| Scottish | 3.2 /100 | #231 | Tragic 83.9% |
| Native Hawaiians | 3.0 /100 | #232 | Tragic 83.9% |
| Immigrants | Germany | 2.8 /100 | #233 | Tragic 83.9% |
| Immigrants | Oceania | 2.6 /100 | #234 | Tragic 83.9% |
| Immigrants | Syria | 2.5 /100 | #235 | Tragic 83.9% |
| West Indians | 2.4 /100 | #236 | Tragic 83.9% |
| English | 1.8 /100 | #237 | Tragic 83.8% |
| Immigrants | Laos | 1.7 /100 | #238 | Tragic 83.8% |
| Celtics | 1.4 /100 | #239 | Tragic 83.8% |
| Arabs | 1.3 /100 | #240 | Tragic 83.8% |
| Iraqis | 1.3 /100 | #241 | Tragic 83.8% |
| Immigrants | Cambodia | 1.1 /100 | #242 | Tragic 83.8% |
| Immigrants | Western Asia | 1.1 /100 | #243 | Tragic 83.8% |