Vietnamese vs Immigrants from Mexico In Labor Force | Age 25-29
COMPARE
Vietnamese
Immigrants from Mexico
In Labor Force | Age 25-29
In Labor Force | Age 25-29 Comparison
Vietnamese
Immigrants from Mexico
82.8%
IN LABOR FORCE | AGE 25-29
0.0/ 100
METRIC RATING
301st/ 347
METRIC RANK
82.0%
IN LABOR FORCE | AGE 25-29
0.0/ 100
METRIC RATING
315th/ 347
METRIC RANK
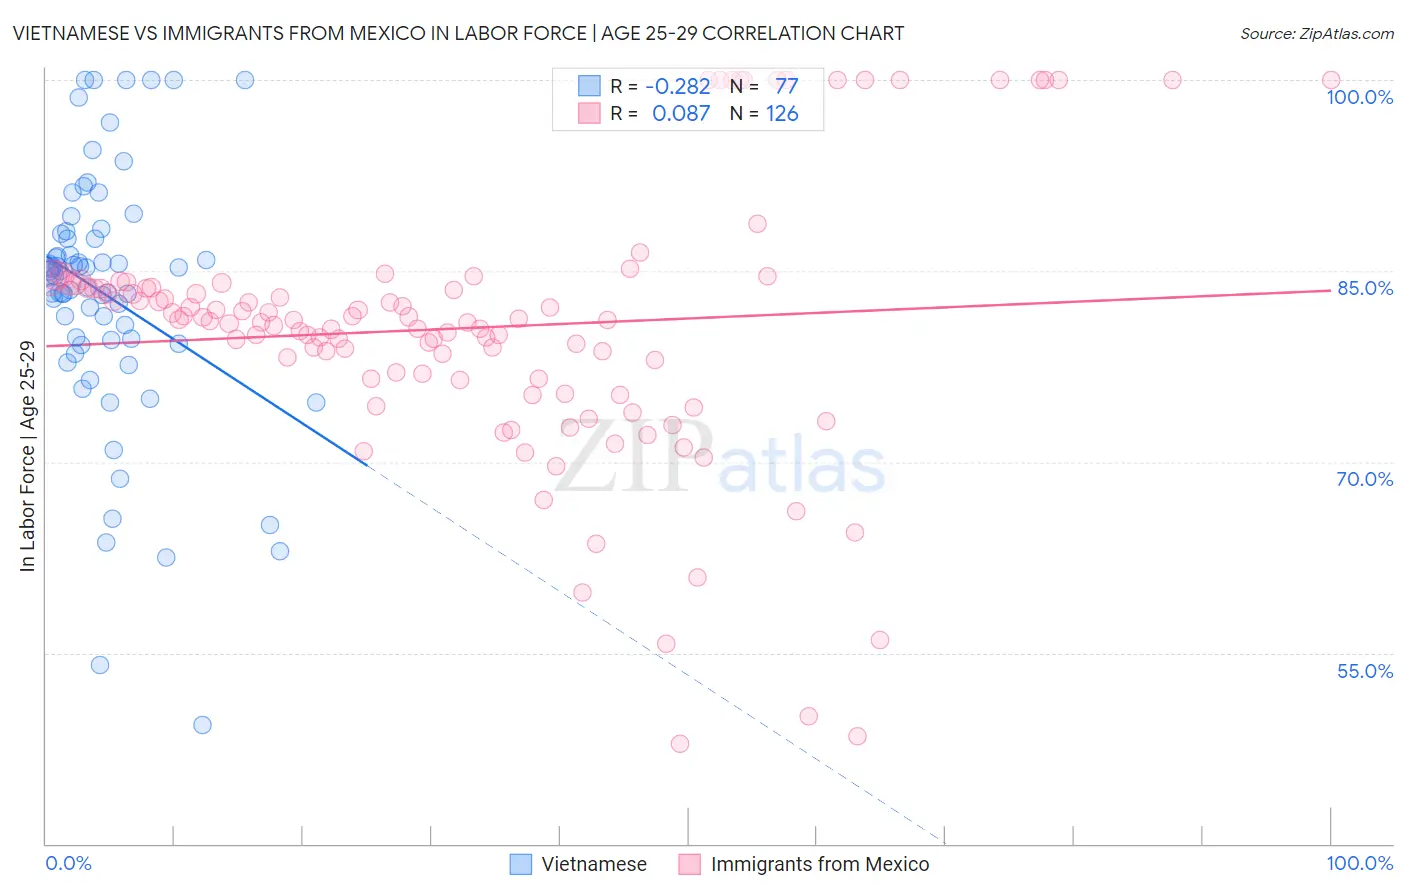
Vietnamese vs Immigrants from Mexico In Labor Force | Age 25-29 Correlation Chart
The statistical analysis conducted on geographies consisting of 170,737,570 people shows a weak negative correlation between the proportion of Vietnamese and labor force participation rate among population between the ages 25 and 29 in the United States with a correlation coefficient (R) of -0.282 and weighted average of 82.8%. Similarly, the statistical analysis conducted on geographies consisting of 513,205,790 people shows a slight positive correlation between the proportion of Immigrants from Mexico and labor force participation rate among population between the ages 25 and 29 in the United States with a correlation coefficient (R) of 0.087 and weighted average of 82.0%, a difference of 1.0%.
In Labor Force | Age 25-29 Correlation Summary
| Measurement | Vietnamese | Immigrants from Mexico |
| Minimum | 49.3% | 47.9% |
| Maximum | 100.0% | 100.0% |
| Range | 50.7% | 52.1% |
| Mean | 83.1% | 80.5% |
| Median | 84.9% | 81.1% |
| Interquartile 25% (IQ1) | 79.4% | 76.5% |
| Interquartile 75% (IQ3) | 87.7% | 83.7% |
| Interquartile Range (IQR) | 8.3% | 7.2% |
| Standard Deviation (Sample) | 10.0% | 10.5% |
| Standard Deviation (Population) | 9.9% | 10.5% |
Demographics Similar to Vietnamese and Immigrants from Mexico by In Labor Force | Age 25-29
In terms of in labor force | age 25-29, the demographic groups most similar to Vietnamese are Immigrants from Belize (82.8%, a difference of 0.030%), Immigrants from Grenada (82.8%, a difference of 0.050%), Spanish American Indian (82.9%, a difference of 0.070%), Fijian (82.9%, a difference of 0.080%), and Native Hawaiian (82.9%, a difference of 0.090%). Similarly, the demographic groups most similar to Immigrants from Mexico are Mexican (81.9%, a difference of 0.090%), Cherokee (82.1%, a difference of 0.13%), Chickasaw (81.9%, a difference of 0.16%), Comanche (81.9%, a difference of 0.17%), and Yaqui (82.2%, a difference of 0.18%).
| Demographics | Rating | Rank | In Labor Force | Age 25-29 |
| Native Hawaiians | 0.0 /100 | #298 | Tragic 82.9% |
| Fijians | 0.0 /100 | #299 | Tragic 82.9% |
| Spanish American Indians | 0.0 /100 | #300 | Tragic 82.9% |
| Vietnamese | 0.0 /100 | #301 | Tragic 82.8% |
| Immigrants | Belize | 0.0 /100 | #302 | Tragic 82.8% |
| Immigrants | Grenada | 0.0 /100 | #303 | Tragic 82.8% |
| Immigrants | St. Vincent and the Grenadines | 0.0 /100 | #304 | Tragic 82.7% |
| Blacks/African Americans | 0.0 /100 | #305 | Tragic 82.6% |
| Blackfeet | 0.0 /100 | #306 | Tragic 82.6% |
| Cajuns | 0.0 /100 | #307 | Tragic 82.5% |
| Central American Indians | 0.0 /100 | #308 | Tragic 82.4% |
| Immigrants | Central America | 0.0 /100 | #309 | Tragic 82.4% |
| Osage | 0.0 /100 | #310 | Tragic 82.3% |
| Alaskan Athabascans | 0.0 /100 | #311 | Tragic 82.3% |
| Hispanics or Latinos | 0.0 /100 | #312 | Tragic 82.2% |
| Yaqui | 0.0 /100 | #313 | Tragic 82.2% |
| Cherokee | 0.0 /100 | #314 | Tragic 82.1% |
| Immigrants | Mexico | 0.0 /100 | #315 | Tragic 82.0% |
| Mexicans | 0.0 /100 | #316 | Tragic 81.9% |
| Chickasaw | 0.0 /100 | #317 | Tragic 81.9% |
| Comanche | 0.0 /100 | #318 | Tragic 81.9% |