Vietnamese vs Finnish Median Earnings
COMPARE
Vietnamese
Finnish
Median Earnings
Median Earnings Comparison
Vietnamese
Finns
$46,172
MEDIAN EARNINGS
40.9/ 100
METRIC RATING
186th/ 347
METRIC RANK
$45,940
MEDIAN EARNINGS
33.4/ 100
METRIC RATING
191st/ 347
METRIC RANK
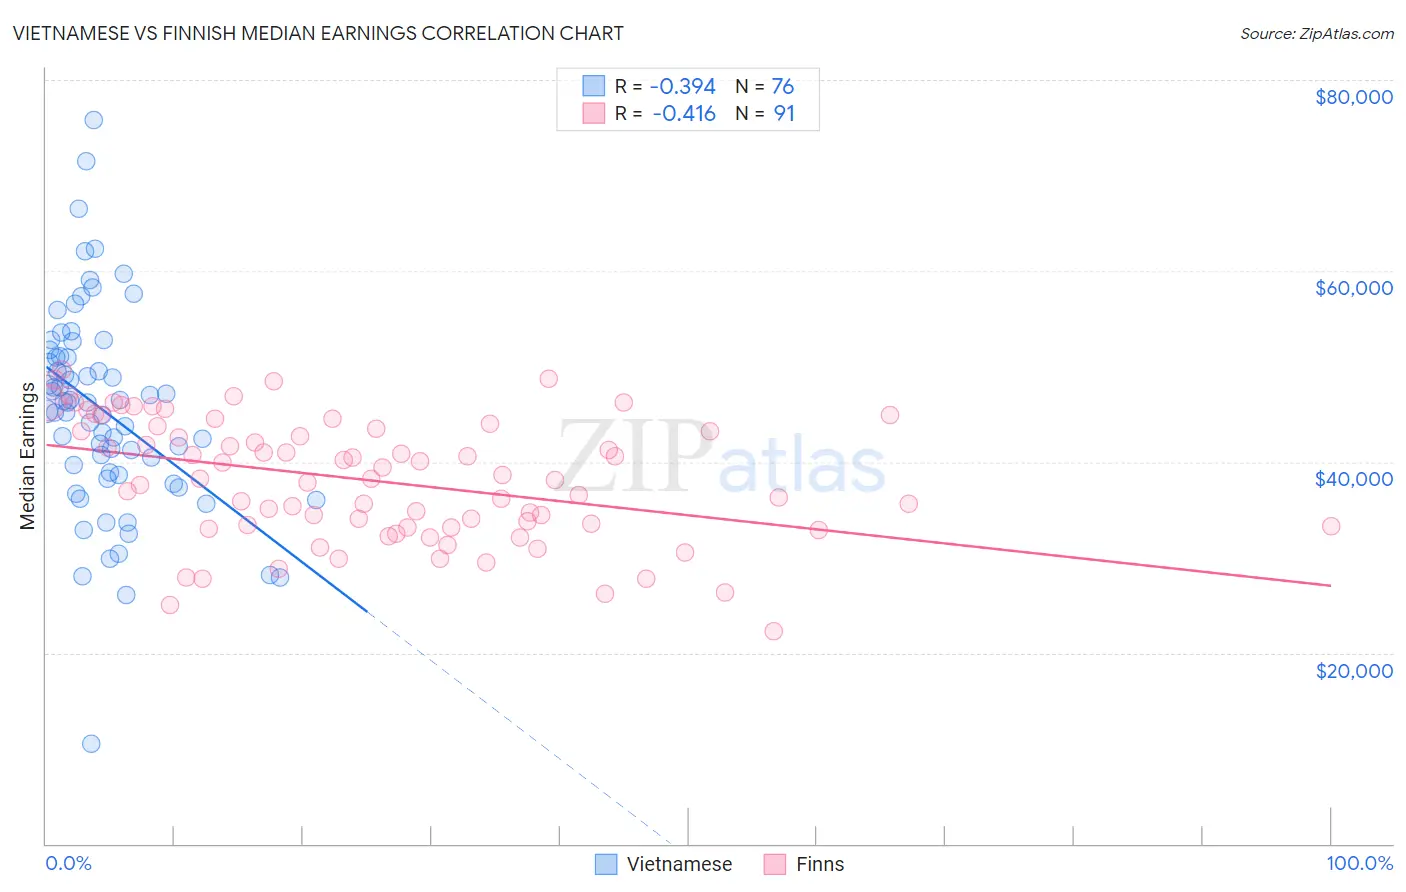
Vietnamese vs Finnish Median Earnings Correlation Chart
The statistical analysis conducted on geographies consisting of 170,754,032 people shows a mild negative correlation between the proportion of Vietnamese and median earnings in the United States with a correlation coefficient (R) of -0.394 and weighted average of $46,172. Similarly, the statistical analysis conducted on geographies consisting of 404,629,884 people shows a moderate negative correlation between the proportion of Finns and median earnings in the United States with a correlation coefficient (R) of -0.416 and weighted average of $45,940, a difference of 0.50%.
Median Earnings Correlation Summary
| Measurement | Vietnamese | Finnish |
| Minimum | $10,473 | $22,232 |
| Maximum | $75,862 | $49,637 |
| Range | $65,389 | $27,405 |
| Mean | $45,384 | $38,029 |
| Median | $46,190 | $38,169 |
| Interquartile 25% (IQ1) | $38,745 | $33,167 |
| Interquartile 75% (IQ3) | $50,994 | $43,485 |
| Interquartile Range (IQR) | $12,249 | $10,318 |
| Standard Deviation (Sample) | $10,718 | $6,403 |
| Standard Deviation (Population) | $10,647 | $6,368 |
Demographics Similar to Vietnamese and Finns by Median Earnings
In terms of median earnings, the demographic groups most similar to Vietnamese are Uruguayan ($46,190, a difference of 0.040%), Iraqi ($46,140, a difference of 0.070%), Immigrants from Kenya ($46,214, a difference of 0.090%), Immigrants from Armenia ($46,094, a difference of 0.17%), and Spaniard ($46,059, a difference of 0.24%). Similarly, the demographic groups most similar to Finns are German ($45,935, a difference of 0.010%), Guamanian/Chamorro ($45,933, a difference of 0.010%), Immigrants from Costa Rica ($45,928, a difference of 0.030%), Immigrants from St. Vincent and the Grenadines ($45,908, a difference of 0.070%), and French Canadian ($46,026, a difference of 0.19%).
| Demographics | Rating | Rank | Median Earnings |
| Colombians | 47.1 /100 | #178 | Average $46,349 |
| English | 46.5 /100 | #179 | Average $46,334 |
| Puget Sound Salish | 46.5 /100 | #180 | Average $46,333 |
| Immigrants | Cameroon | 46.4 /100 | #181 | Average $46,329 |
| Swiss | 45.9 /100 | #182 | Average $46,315 |
| French | 45.2 /100 | #183 | Average $46,296 |
| Immigrants | Kenya | 42.4 /100 | #184 | Average $46,214 |
| Uruguayans | 41.6 /100 | #185 | Average $46,190 |
| Vietnamese | 40.9 /100 | #186 | Average $46,172 |
| Iraqis | 39.9 /100 | #187 | Fair $46,140 |
| Immigrants | Armenia | 38.3 /100 | #188 | Fair $46,094 |
| Spaniards | 37.2 /100 | #189 | Fair $46,059 |
| French Canadians | 36.1 /100 | #190 | Fair $46,026 |
| Finns | 33.4 /100 | #191 | Fair $45,940 |
| Germans | 33.2 /100 | #192 | Fair $45,935 |
| Guamanians/Chamorros | 33.2 /100 | #193 | Fair $45,933 |
| Immigrants | Costa Rica | 33.0 /100 | #194 | Fair $45,928 |
| Immigrants | St. Vincent and the Grenadines | 32.4 /100 | #195 | Fair $45,908 |
| Yugoslavians | 30.5 /100 | #196 | Fair $45,846 |
| Barbadians | 30.5 /100 | #197 | Fair $45,846 |
| Trinidadians and Tobagonians | 29.7 /100 | #198 | Fair $45,820 |