Vietnamese vs Immigrants from North Macedonia In Labor Force | Age 25-29
COMPARE
Vietnamese
Immigrants from North Macedonia
In Labor Force | Age 25-29
In Labor Force | Age 25-29 Comparison
Vietnamese
Immigrants from North Macedonia
82.8%
IN LABOR FORCE | AGE 25-29
0.0/ 100
METRIC RATING
301st/ 347
METRIC RANK
85.9%
IN LABOR FORCE | AGE 25-29
100.0/ 100
METRIC RATING
26th/ 347
METRIC RANK
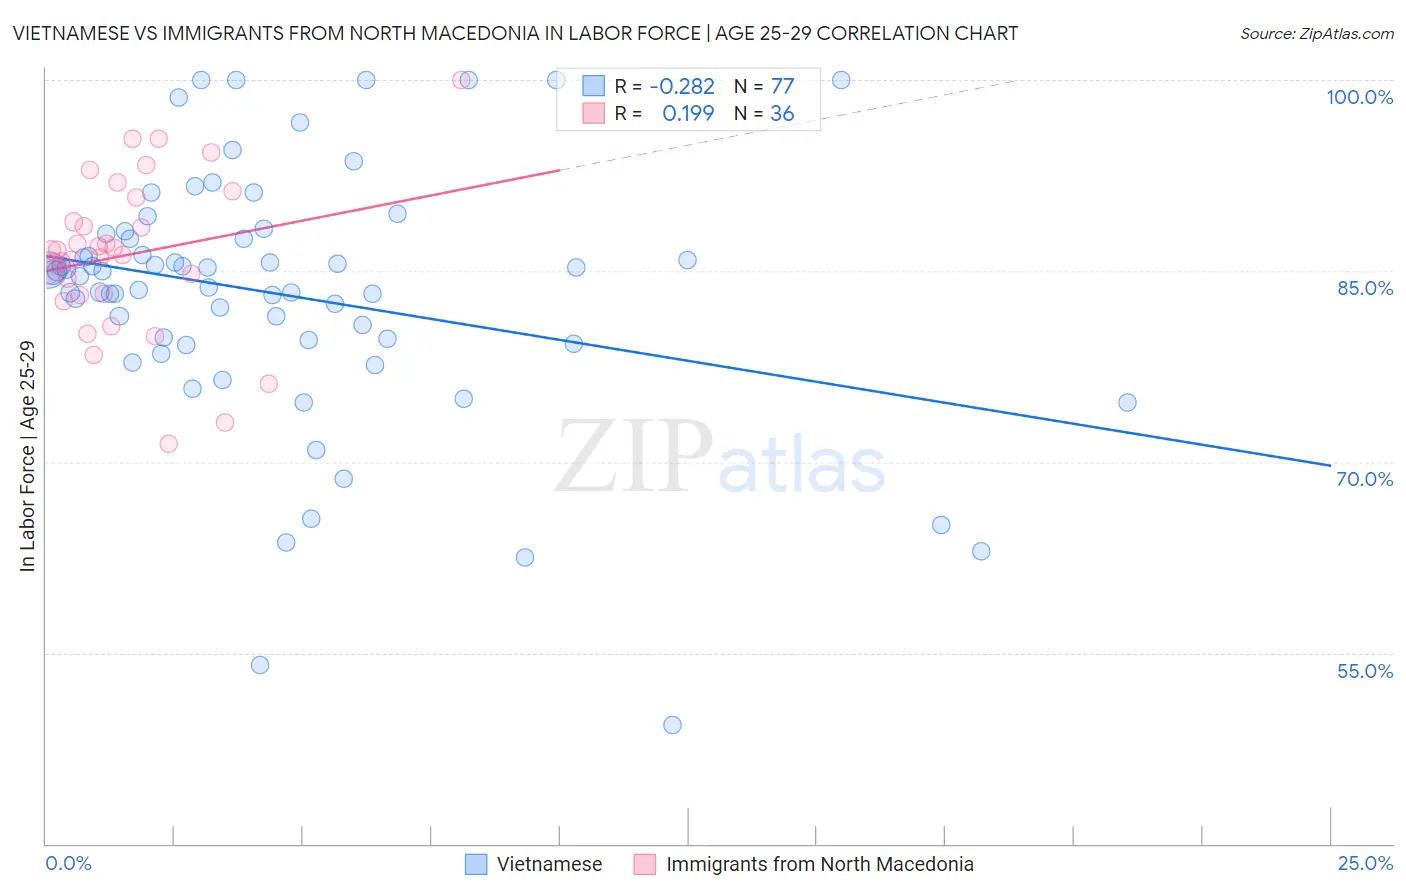
Vietnamese vs Immigrants from North Macedonia In Labor Force | Age 25-29 Correlation Chart
The statistical analysis conducted on geographies consisting of 170,737,570 people shows a weak negative correlation between the proportion of Vietnamese and labor force participation rate among population between the ages 25 and 29 in the United States with a correlation coefficient (R) of -0.282 and weighted average of 82.8%. Similarly, the statistical analysis conducted on geographies consisting of 74,314,976 people shows a poor positive correlation between the proportion of Immigrants from North Macedonia and labor force participation rate among population between the ages 25 and 29 in the United States with a correlation coefficient (R) of 0.199 and weighted average of 85.9%, a difference of 3.7%.
In Labor Force | Age 25-29 Correlation Summary
| Measurement | Vietnamese | Immigrants from North Macedonia |
| Minimum | 49.3% | 71.4% |
| Maximum | 100.0% | 100.0% |
| Range | 50.7% | 28.6% |
| Mean | 83.1% | 86.3% |
| Median | 84.9% | 86.4% |
| Interquartile 25% (IQ1) | 79.4% | 83.2% |
| Interquartile 75% (IQ3) | 87.7% | 89.8% |
| Interquartile Range (IQR) | 8.3% | 6.6% |
| Standard Deviation (Sample) | 10.0% | 6.1% |
| Standard Deviation (Population) | 9.9% | 6.1% |
Similar Demographics by In Labor Force | Age 25-29
Demographics Similar to Vietnamese by In Labor Force | Age 25-29
In terms of in labor force | age 25-29, the demographic groups most similar to Vietnamese are Immigrants from Belize (82.8%, a difference of 0.030%), Immigrants from Grenada (82.8%, a difference of 0.050%), Spanish American Indian (82.9%, a difference of 0.070%), Fijian (82.9%, a difference of 0.080%), and Native Hawaiian (82.9%, a difference of 0.090%).
| Demographics | Rating | Rank | In Labor Force | Age 25-29 |
| Nepalese | 0.0 /100 | #294 | Tragic 82.9% |
| Chippewa | 0.0 /100 | #295 | Tragic 82.9% |
| Immigrants | Nicaragua | 0.0 /100 | #296 | Tragic 82.9% |
| Potawatomi | 0.0 /100 | #297 | Tragic 82.9% |
| Native Hawaiians | 0.0 /100 | #298 | Tragic 82.9% |
| Fijians | 0.0 /100 | #299 | Tragic 82.9% |
| Spanish American Indians | 0.0 /100 | #300 | Tragic 82.9% |
| Vietnamese | 0.0 /100 | #301 | Tragic 82.8% |
| Immigrants | Belize | 0.0 /100 | #302 | Tragic 82.8% |
| Immigrants | Grenada | 0.0 /100 | #303 | Tragic 82.8% |
| Immigrants | St. Vincent and the Grenadines | 0.0 /100 | #304 | Tragic 82.7% |
| Blacks/African Americans | 0.0 /100 | #305 | Tragic 82.6% |
| Blackfeet | 0.0 /100 | #306 | Tragic 82.6% |
| Cajuns | 0.0 /100 | #307 | Tragic 82.5% |
| Central American Indians | 0.0 /100 | #308 | Tragic 82.4% |
Demographics Similar to Immigrants from North Macedonia by In Labor Force | Age 25-29
In terms of in labor force | age 25-29, the demographic groups most similar to Immigrants from North Macedonia are Paraguayan (85.9%, a difference of 0.010%), Ugandan (85.9%, a difference of 0.020%), Immigrants from Liberia (85.9%, a difference of 0.020%), Sudanese (85.9%, a difference of 0.060%), and Immigrants from Serbia (85.9%, a difference of 0.060%).
| Demographics | Rating | Rank | In Labor Force | Age 25-29 |
| Cape Verdeans | 100.0 /100 | #19 | Exceptional 86.0% |
| Immigrants | Ireland | 100.0 /100 | #20 | Exceptional 86.0% |
| Maltese | 100.0 /100 | #21 | Exceptional 86.0% |
| Cambodians | 100.0 /100 | #22 | Exceptional 86.0% |
| Immigrants | Uganda | 100.0 /100 | #23 | Exceptional 86.0% |
| Immigrants | Eastern Africa | 100.0 /100 | #24 | Exceptional 86.0% |
| Sudanese | 100.0 /100 | #25 | Exceptional 85.9% |
| Immigrants | North Macedonia | 100.0 /100 | #26 | Exceptional 85.9% |
| Paraguayans | 100.0 /100 | #27 | Exceptional 85.9% |
| Ugandans | 100.0 /100 | #28 | Exceptional 85.9% |
| Immigrants | Liberia | 100.0 /100 | #29 | Exceptional 85.9% |
| Immigrants | Serbia | 100.0 /100 | #30 | Exceptional 85.9% |
| German Russians | 100.0 /100 | #31 | Exceptional 85.8% |
| Slovaks | 100.0 /100 | #32 | Exceptional 85.8% |
| Immigrants | Bulgaria | 100.0 /100 | #33 | Exceptional 85.8% |