Vietnamese vs Finnish Poverty
COMPARE
Vietnamese
Finnish
Poverty
Poverty Comparison
Vietnamese
Finns
15.0%
POVERTY
0.0/ 100
METRIC RATING
285th/ 347
METRIC RANK
11.4%
POVERTY
95.2/ 100
METRIC RATING
91st/ 347
METRIC RANK
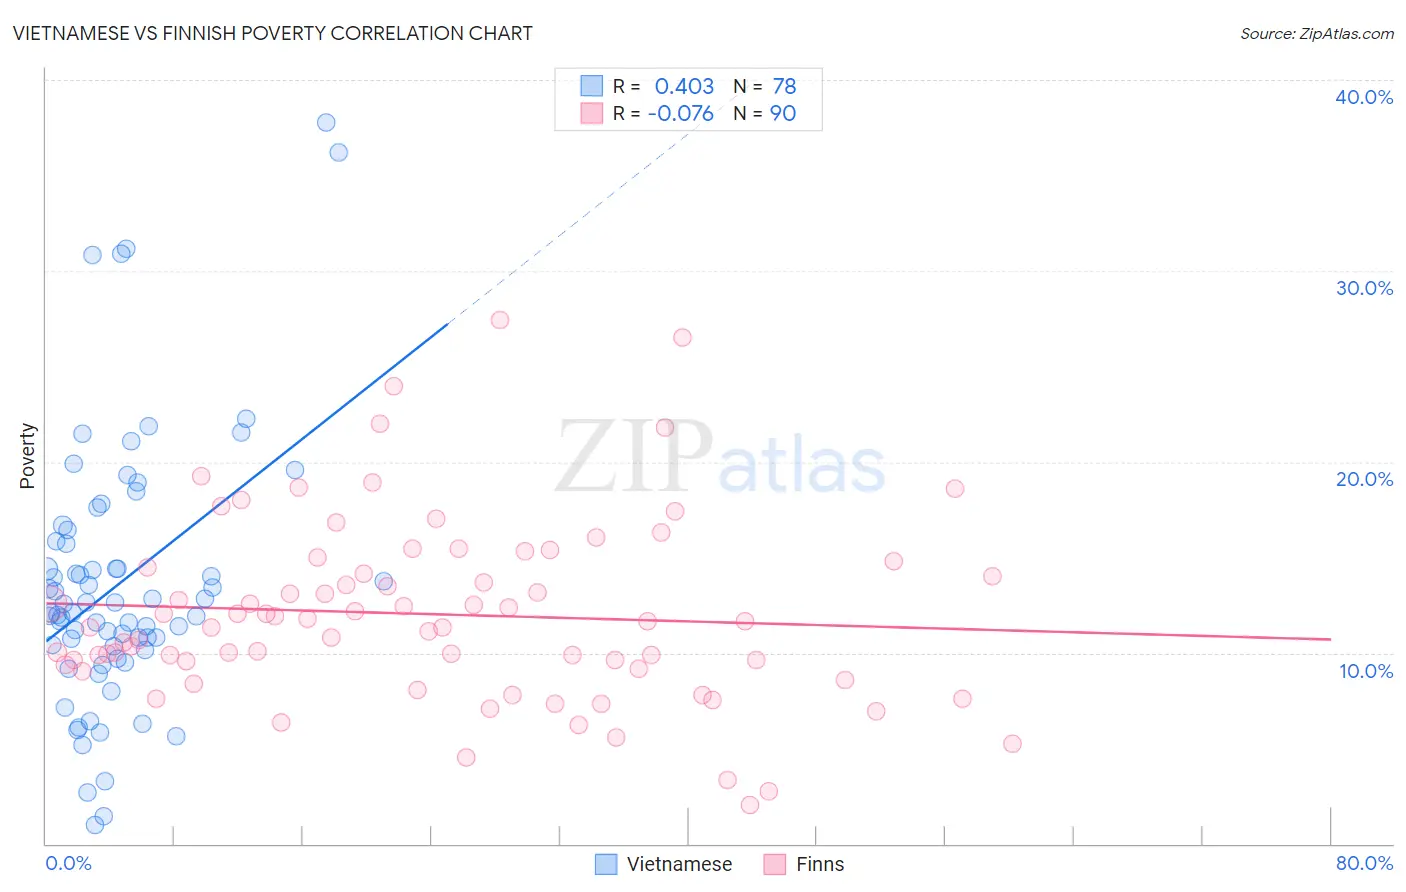
Vietnamese vs Finnish Poverty Correlation Chart
The statistical analysis conducted on geographies consisting of 170,677,568 people shows a moderate positive correlation between the proportion of Vietnamese and poverty level in the United States with a correlation coefficient (R) of 0.403 and weighted average of 15.0%. Similarly, the statistical analysis conducted on geographies consisting of 404,501,473 people shows a slight negative correlation between the proportion of Finns and poverty level in the United States with a correlation coefficient (R) of -0.076 and weighted average of 11.4%, a difference of 31.3%.
Poverty Correlation Summary
| Measurement | Vietnamese | Finnish |
| Minimum | 1.0% | 2.0% |
| Maximum | 37.7% | 27.4% |
| Range | 36.7% | 25.4% |
| Mean | 13.6% | 12.0% |
| Median | 12.3% | 11.5% |
| Interquartile 25% (IQ1) | 10.4% | 9.4% |
| Interquartile 75% (IQ3) | 15.9% | 14.5% |
| Interquartile Range (IQR) | 5.5% | 5.1% |
| Standard Deviation (Sample) | 7.0% | 4.8% |
| Standard Deviation (Population) | 7.0% | 4.8% |
Similar Demographics by Poverty
Demographics Similar to Vietnamese by Poverty
In terms of poverty, the demographic groups most similar to Vietnamese are West Indian (15.0%, a difference of 0.050%), Immigrants from Haiti (15.0%, a difference of 0.16%), Immigrants from Latin America (15.0%, a difference of 0.26%), Comanche (15.0%, a difference of 0.28%), and Inupiat (15.1%, a difference of 0.47%).
| Demographics | Rating | Rank | Poverty |
| Belizeans | 0.0 /100 | #278 | Tragic 14.8% |
| Immigrants | St. Vincent and the Grenadines | 0.0 /100 | #279 | Tragic 14.9% |
| Haitians | 0.0 /100 | #280 | Tragic 14.9% |
| Immigrants | Barbados | 0.0 /100 | #281 | Tragic 14.9% |
| Comanche | 0.0 /100 | #282 | Tragic 15.0% |
| Immigrants | Haiti | 0.0 /100 | #283 | Tragic 15.0% |
| West Indians | 0.0 /100 | #284 | Tragic 15.0% |
| Vietnamese | 0.0 /100 | #285 | Tragic 15.0% |
| Immigrants | Latin America | 0.0 /100 | #286 | Tragic 15.0% |
| Inupiat | 0.0 /100 | #287 | Tragic 15.1% |
| Yaqui | 0.0 /100 | #288 | Tragic 15.1% |
| Immigrants | Belize | 0.0 /100 | #289 | Tragic 15.1% |
| Mexicans | 0.0 /100 | #290 | Tragic 15.1% |
| Immigrants | Cabo Verde | 0.0 /100 | #291 | Tragic 15.1% |
| Indonesians | 0.0 /100 | #292 | Tragic 15.1% |
Demographics Similar to Finns by Poverty
In terms of poverty, the demographic groups most similar to Finns are Immigrants from Denmark (11.4%, a difference of 0.13%), British (11.4%, a difference of 0.14%), Romanian (11.4%, a difference of 0.17%), Paraguayan (11.4%, a difference of 0.19%), and Australian (11.4%, a difference of 0.20%).
| Demographics | Rating | Rank | Poverty |
| English | 96.3 /100 | #84 | Exceptional 11.3% |
| Immigrants | England | 96.2 /100 | #85 | Exceptional 11.4% |
| Jordanians | 96.0 /100 | #86 | Exceptional 11.4% |
| Northern Europeans | 96.0 /100 | #87 | Exceptional 11.4% |
| Belgians | 95.8 /100 | #88 | Exceptional 11.4% |
| Czechoslovakians | 95.7 /100 | #89 | Exceptional 11.4% |
| Immigrants | Denmark | 95.5 /100 | #90 | Exceptional 11.4% |
| Finns | 95.2 /100 | #91 | Exceptional 11.4% |
| British | 95.0 /100 | #92 | Exceptional 11.4% |
| Romanians | 94.9 /100 | #93 | Exceptional 11.4% |
| Paraguayans | 94.9 /100 | #94 | Exceptional 11.4% |
| Australians | 94.9 /100 | #95 | Exceptional 11.4% |
| Immigrants | South Africa | 94.7 /100 | #96 | Exceptional 11.5% |
| Immigrants | Egypt | 94.6 /100 | #97 | Exceptional 11.5% |
| Immigrants | Latvia | 94.5 /100 | #98 | Exceptional 11.5% |