Vietnamese vs Choctaw In Labor Force | Age 45-54
COMPARE
Vietnamese
Choctaw
In Labor Force | Age 45-54
In Labor Force | Age 45-54 Comparison
Vietnamese
Choctaw
80.8%
IN LABOR FORCE | AGE 45-54
0.0/ 100
METRIC RATING
287th/ 347
METRIC RANK
78.2%
IN LABOR FORCE | AGE 45-54
0.0/ 100
METRIC RATING
325th/ 347
METRIC RANK
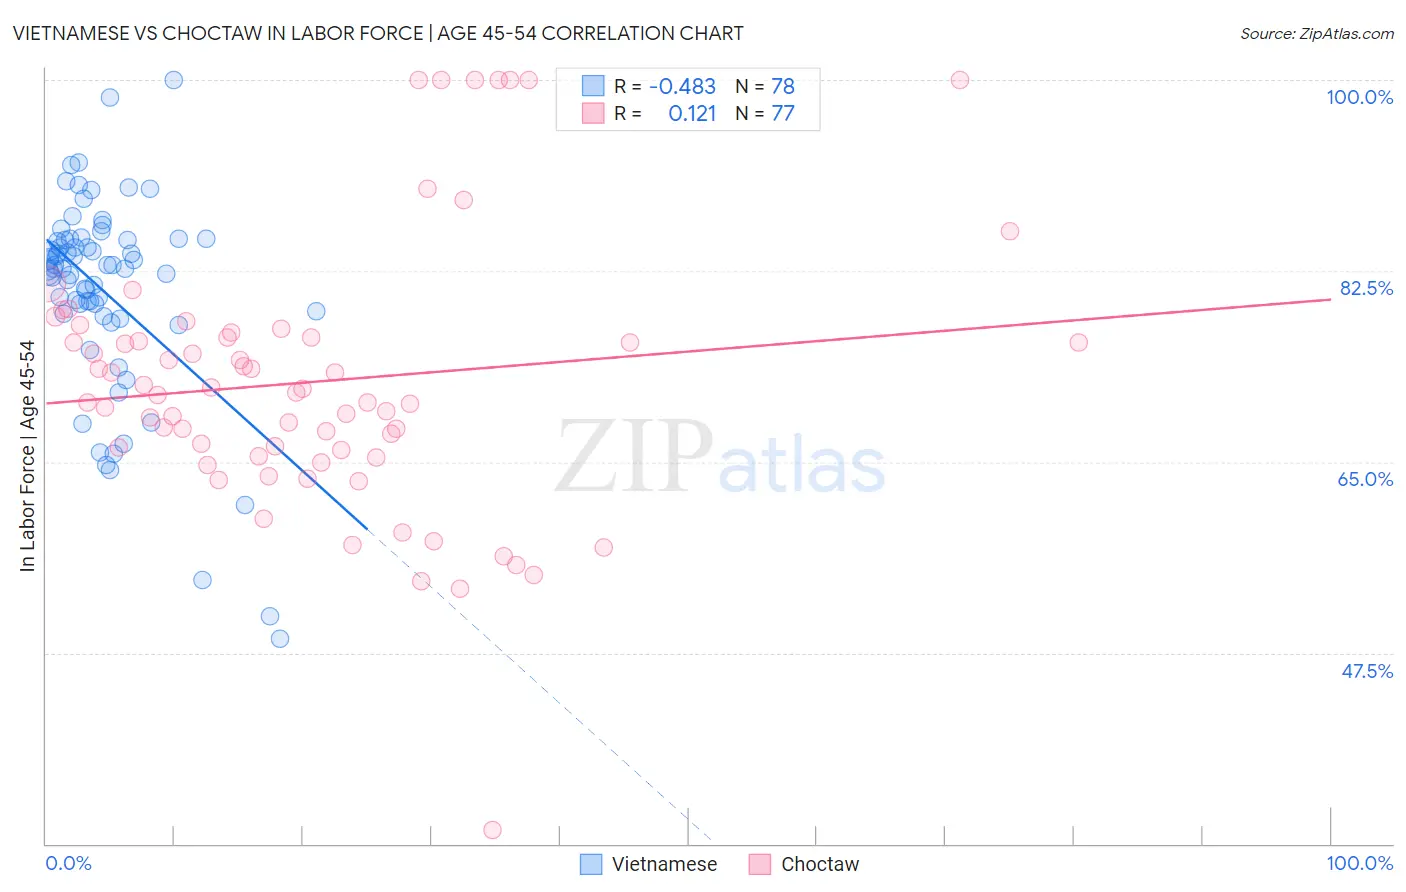
Vietnamese vs Choctaw In Labor Force | Age 45-54 Correlation Chart
The statistical analysis conducted on geographies consisting of 170,653,074 people shows a moderate negative correlation between the proportion of Vietnamese and labor force participation rate among population between the ages 45 and 54 in the United States with a correlation coefficient (R) of -0.483 and weighted average of 80.8%. Similarly, the statistical analysis conducted on geographies consisting of 269,621,140 people shows a poor positive correlation between the proportion of Choctaw and labor force participation rate among population between the ages 45 and 54 in the United States with a correlation coefficient (R) of 0.121 and weighted average of 78.2%, a difference of 3.3%.
In Labor Force | Age 45-54 Correlation Summary
| Measurement | Vietnamese | Choctaw |
| Minimum | 48.8% | 31.3% |
| Maximum | 100.0% | 100.0% |
| Range | 51.2% | 68.7% |
| Mean | 80.5% | 72.4% |
| Median | 82.7% | 71.3% |
| Interquartile 25% (IQ1) | 78.6% | 65.8% |
| Interquartile 75% (IQ3) | 85.3% | 76.6% |
| Interquartile Range (IQR) | 6.8% | 10.8% |
| Standard Deviation (Sample) | 9.4% | 12.4% |
| Standard Deviation (Population) | 9.3% | 12.3% |
Similar Demographics by In Labor Force | Age 45-54
Demographics Similar to Vietnamese by In Labor Force | Age 45-54
In terms of in labor force | age 45-54, the demographic groups most similar to Vietnamese are Immigrants from Dominica (80.8%, a difference of 0.0%), Cree (80.8%, a difference of 0.0%), Delaware (80.8%, a difference of 0.010%), Belizean (80.8%, a difference of 0.020%), and Immigrants from Bangladesh (80.7%, a difference of 0.030%).
| Demographics | Rating | Rank | In Labor Force | Age 45-54 |
| Immigrants | Latin America | 0.0 /100 | #280 | Tragic 81.0% |
| Immigrants | Grenada | 0.0 /100 | #281 | Tragic 81.0% |
| Aleuts | 0.0 /100 | #282 | Tragic 81.0% |
| French American Indians | 0.0 /100 | #283 | Tragic 80.8% |
| Belizeans | 0.0 /100 | #284 | Tragic 80.8% |
| Delaware | 0.0 /100 | #285 | Tragic 80.8% |
| Immigrants | Dominica | 0.0 /100 | #286 | Tragic 80.8% |
| Vietnamese | 0.0 /100 | #287 | Tragic 80.8% |
| Cree | 0.0 /100 | #288 | Tragic 80.8% |
| Immigrants | Bangladesh | 0.0 /100 | #289 | Tragic 80.7% |
| Mexican American Indians | 0.0 /100 | #290 | Tragic 80.7% |
| Immigrants | Belize | 0.0 /100 | #291 | Tragic 80.6% |
| Iroquois | 0.0 /100 | #292 | Tragic 80.6% |
| Osage | 0.0 /100 | #293 | Tragic 80.6% |
| Yakama | 0.0 /100 | #294 | Tragic 80.6% |
Demographics Similar to Choctaw by In Labor Force | Age 45-54
In terms of in labor force | age 45-54, the demographic groups most similar to Choctaw are Seminole (78.1%, a difference of 0.050%), Cajun (78.1%, a difference of 0.050%), Dutch West Indian (78.2%, a difference of 0.090%), Kiowa (78.3%, a difference of 0.11%), and Crow (78.3%, a difference of 0.20%).
| Demographics | Rating | Rank | In Labor Force | Age 45-54 |
| Chickasaw | 0.0 /100 | #318 | Tragic 79.0% |
| Cherokee | 0.0 /100 | #319 | Tragic 79.0% |
| Yaqui | 0.0 /100 | #320 | Tragic 78.9% |
| Yup'ik | 0.0 /100 | #321 | Tragic 78.6% |
| Crow | 0.0 /100 | #322 | Tragic 78.3% |
| Kiowa | 0.0 /100 | #323 | Tragic 78.3% |
| Dutch West Indians | 0.0 /100 | #324 | Tragic 78.2% |
| Choctaw | 0.0 /100 | #325 | Tragic 78.2% |
| Seminole | 0.0 /100 | #326 | Tragic 78.1% |
| Cajuns | 0.0 /100 | #327 | Tragic 78.1% |
| Sioux | 0.0 /100 | #328 | Tragic 78.0% |
| Creek | 0.0 /100 | #329 | Tragic 77.7% |
| Cheyenne | 0.0 /100 | #330 | Tragic 77.6% |
| Tsimshian | 0.0 /100 | #331 | Tragic 77.4% |
| Menominee | 0.0 /100 | #332 | Tragic 77.4% |