Vietnamese vs Trinidadian and Tobagonian In Labor Force | Age 45-54
COMPARE
Vietnamese
Trinidadian and Tobagonian
In Labor Force | Age 45-54
In Labor Force | Age 45-54 Comparison
Vietnamese
Trinidadians and Tobagonians
80.8%
IN LABOR FORCE | AGE 45-54
0.0/ 100
METRIC RATING
287th/ 347
METRIC RANK
81.9%
IN LABOR FORCE | AGE 45-54
1.1/ 100
METRIC RATING
238th/ 347
METRIC RANK
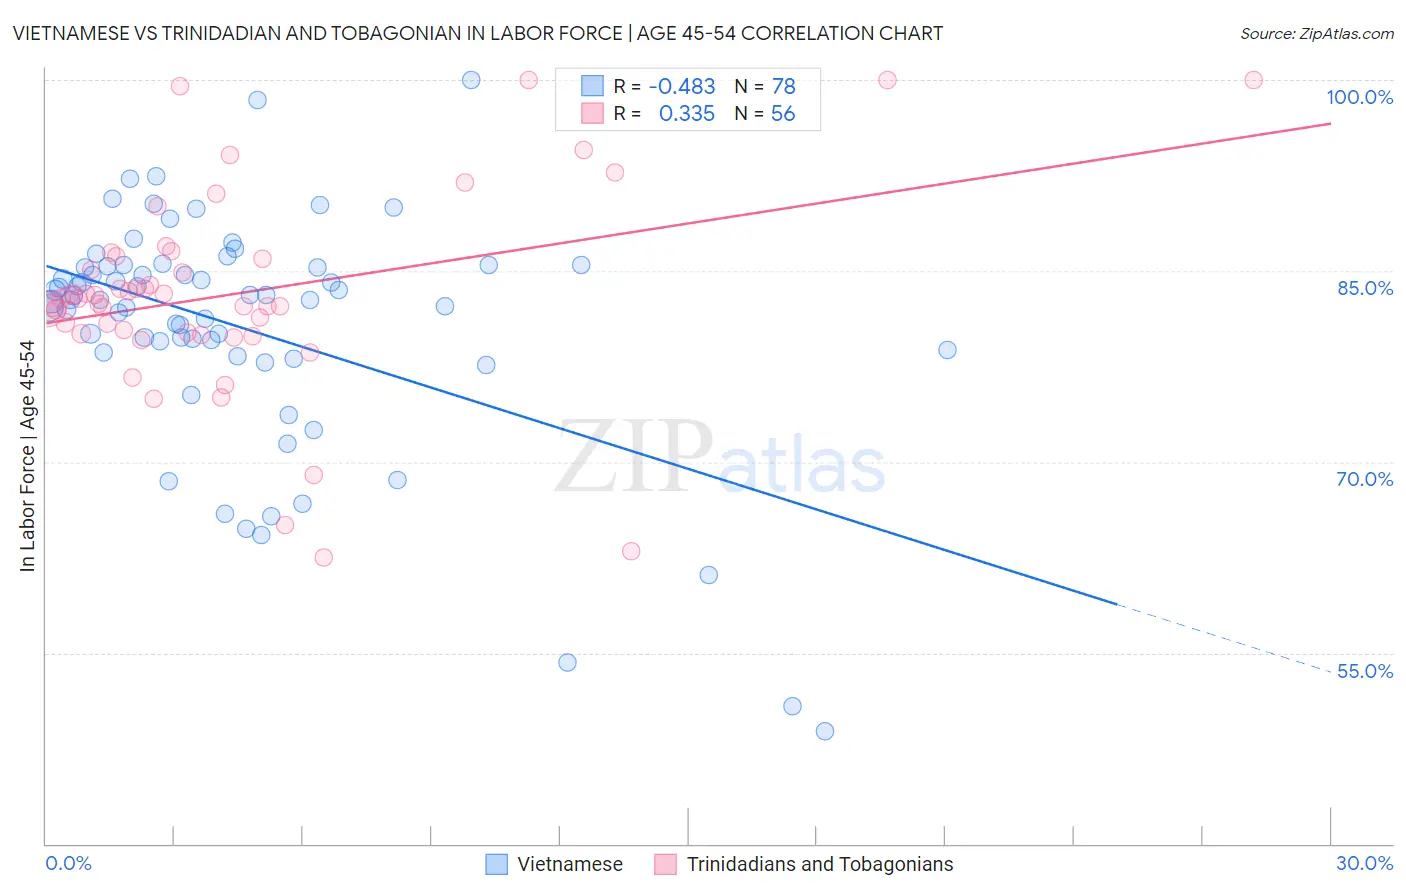
Vietnamese vs Trinidadian and Tobagonian In Labor Force | Age 45-54 Correlation Chart
The statistical analysis conducted on geographies consisting of 170,653,074 people shows a moderate negative correlation between the proportion of Vietnamese and labor force participation rate among population between the ages 45 and 54 in the United States with a correlation coefficient (R) of -0.483 and weighted average of 80.8%. Similarly, the statistical analysis conducted on geographies consisting of 219,704,742 people shows a mild positive correlation between the proportion of Trinidadians and Tobagonians and labor force participation rate among population between the ages 45 and 54 in the United States with a correlation coefficient (R) of 0.335 and weighted average of 81.9%, a difference of 1.5%.
In Labor Force | Age 45-54 Correlation Summary
| Measurement | Vietnamese | Trinidadian and Tobagonian |
| Minimum | 48.8% | 62.5% |
| Maximum | 100.0% | 100.0% |
| Range | 51.2% | 37.5% |
| Mean | 80.5% | 83.2% |
| Median | 82.7% | 82.8% |
| Interquartile 25% (IQ1) | 78.6% | 80.1% |
| Interquartile 75% (IQ3) | 85.3% | 86.1% |
| Interquartile Range (IQR) | 6.8% | 6.0% |
| Standard Deviation (Sample) | 9.4% | 7.9% |
| Standard Deviation (Population) | 9.3% | 7.8% |
Similar Demographics by In Labor Force | Age 45-54
Demographics Similar to Vietnamese by In Labor Force | Age 45-54
In terms of in labor force | age 45-54, the demographic groups most similar to Vietnamese are Immigrants from Dominica (80.8%, a difference of 0.0%), Cree (80.8%, a difference of 0.0%), Delaware (80.8%, a difference of 0.010%), Belizean (80.8%, a difference of 0.020%), and Immigrants from Bangladesh (80.7%, a difference of 0.030%).
| Demographics | Rating | Rank | In Labor Force | Age 45-54 |
| Immigrants | Latin America | 0.0 /100 | #280 | Tragic 81.0% |
| Immigrants | Grenada | 0.0 /100 | #281 | Tragic 81.0% |
| Aleuts | 0.0 /100 | #282 | Tragic 81.0% |
| French American Indians | 0.0 /100 | #283 | Tragic 80.8% |
| Belizeans | 0.0 /100 | #284 | Tragic 80.8% |
| Delaware | 0.0 /100 | #285 | Tragic 80.8% |
| Immigrants | Dominica | 0.0 /100 | #286 | Tragic 80.8% |
| Vietnamese | 0.0 /100 | #287 | Tragic 80.8% |
| Cree | 0.0 /100 | #288 | Tragic 80.8% |
| Immigrants | Bangladesh | 0.0 /100 | #289 | Tragic 80.7% |
| Mexican American Indians | 0.0 /100 | #290 | Tragic 80.7% |
| Immigrants | Belize | 0.0 /100 | #291 | Tragic 80.6% |
| Iroquois | 0.0 /100 | #292 | Tragic 80.6% |
| Osage | 0.0 /100 | #293 | Tragic 80.6% |
| Yakama | 0.0 /100 | #294 | Tragic 80.6% |
Demographics Similar to Trinidadians and Tobagonians by In Labor Force | Age 45-54
In terms of in labor force | age 45-54, the demographic groups most similar to Trinidadians and Tobagonians are Basque (82.0%, a difference of 0.010%), Immigrants from Trinidad and Tobago (82.0%, a difference of 0.010%), Subsaharan African (82.0%, a difference of 0.020%), Immigrants from Thailand (81.9%, a difference of 0.030%), and Immigrants from El Salvador (81.9%, a difference of 0.030%).
| Demographics | Rating | Rank | In Labor Force | Age 45-54 |
| Immigrants | Senegal | 1.7 /100 | #231 | Tragic 82.0% |
| Immigrants | Portugal | 1.7 /100 | #232 | Tragic 82.0% |
| Malaysians | 1.7 /100 | #233 | Tragic 82.0% |
| Salvadorans | 1.7 /100 | #234 | Tragic 82.0% |
| Sub-Saharan Africans | 1.2 /100 | #235 | Tragic 82.0% |
| Basques | 1.2 /100 | #236 | Tragic 82.0% |
| Immigrants | Trinidad and Tobago | 1.2 /100 | #237 | Tragic 82.0% |
| Trinidadians and Tobagonians | 1.1 /100 | #238 | Tragic 81.9% |
| Immigrants | Thailand | 1.0 /100 | #239 | Tragic 81.9% |
| Immigrants | El Salvador | 1.0 /100 | #240 | Tragic 81.9% |
| Immigrants | Cambodia | 0.8 /100 | #241 | Tragic 81.9% |
| Whites/Caucasians | 0.7 /100 | #242 | Tragic 81.9% |
| Samoans | 0.6 /100 | #243 | Tragic 81.8% |
| Celtics | 0.4 /100 | #244 | Tragic 81.8% |
| Alaska Natives | 0.4 /100 | #245 | Tragic 81.8% |