Vietnamese vs Immigrants from Egypt In Labor Force | Age 45-54
COMPARE
Vietnamese
Immigrants from Egypt
In Labor Force | Age 45-54
In Labor Force | Age 45-54 Comparison
Vietnamese
Immigrants from Egypt
80.8%
IN LABOR FORCE | AGE 45-54
0.0/ 100
METRIC RATING
287th/ 347
METRIC RANK
83.4%
IN LABOR FORCE | AGE 45-54
96.6/ 100
METRIC RATING
78th/ 347
METRIC RANK
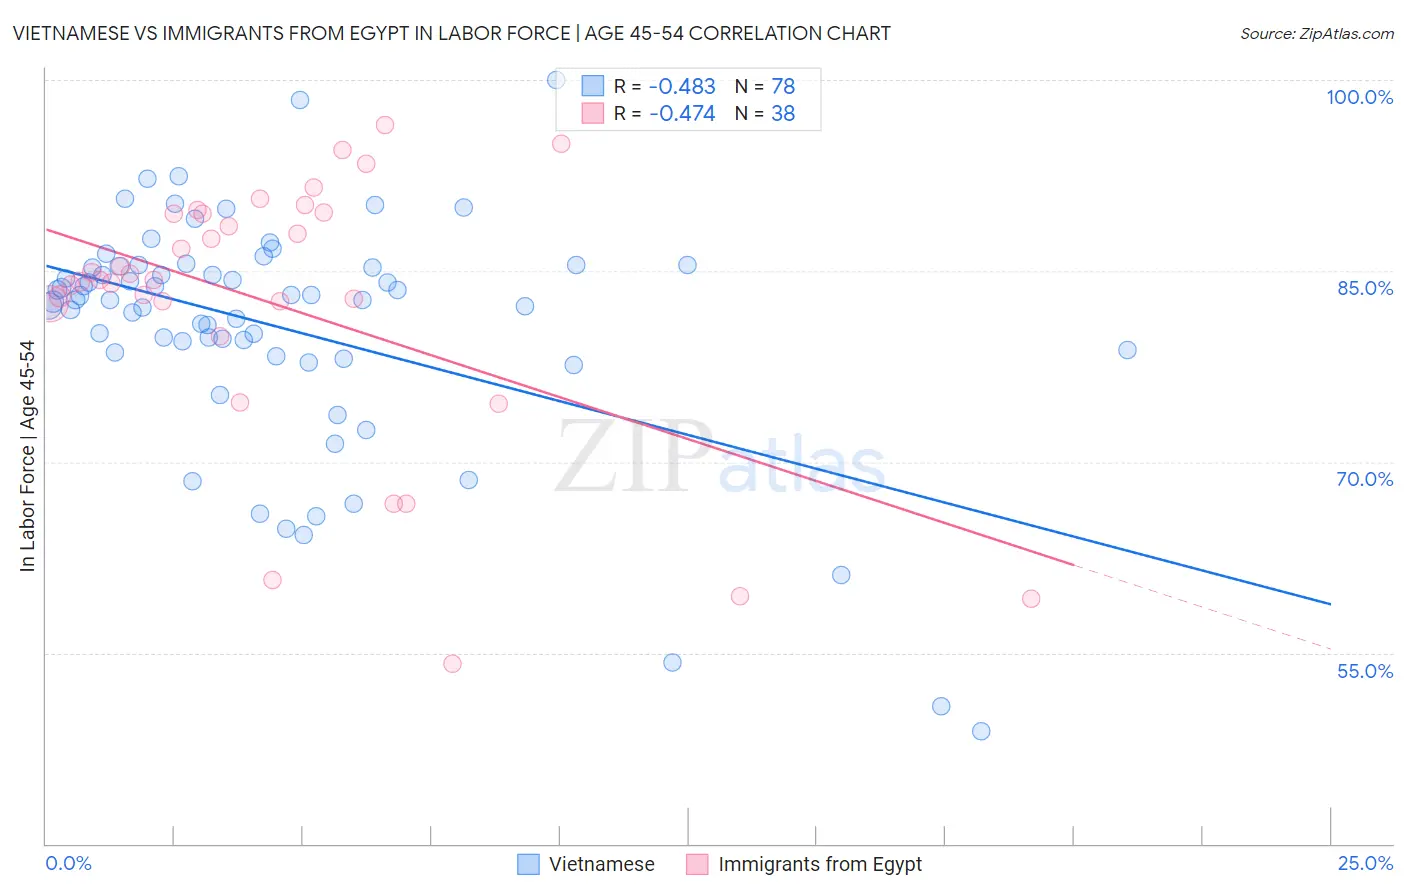
Vietnamese vs Immigrants from Egypt In Labor Force | Age 45-54 Correlation Chart
The statistical analysis conducted on geographies consisting of 170,653,074 people shows a moderate negative correlation between the proportion of Vietnamese and labor force participation rate among population between the ages 45 and 54 in the United States with a correlation coefficient (R) of -0.483 and weighted average of 80.8%. Similarly, the statistical analysis conducted on geographies consisting of 245,402,368 people shows a moderate negative correlation between the proportion of Immigrants from Egypt and labor force participation rate among population between the ages 45 and 54 in the United States with a correlation coefficient (R) of -0.474 and weighted average of 83.4%, a difference of 3.2%.
In Labor Force | Age 45-54 Correlation Summary
| Measurement | Vietnamese | Immigrants from Egypt |
| Minimum | 48.8% | 54.1% |
| Maximum | 100.0% | 96.5% |
| Range | 51.2% | 42.4% |
| Mean | 80.5% | 82.3% |
| Median | 82.7% | 84.3% |
| Interquartile 25% (IQ1) | 78.6% | 82.4% |
| Interquartile 75% (IQ3) | 85.3% | 89.5% |
| Interquartile Range (IQR) | 6.8% | 7.1% |
| Standard Deviation (Sample) | 9.4% | 10.6% |
| Standard Deviation (Population) | 9.3% | 10.5% |
Similar Demographics by In Labor Force | Age 45-54
Demographics Similar to Vietnamese by In Labor Force | Age 45-54
In terms of in labor force | age 45-54, the demographic groups most similar to Vietnamese are Immigrants from Dominica (80.8%, a difference of 0.0%), Cree (80.8%, a difference of 0.0%), Delaware (80.8%, a difference of 0.010%), Belizean (80.8%, a difference of 0.020%), and Immigrants from Bangladesh (80.7%, a difference of 0.030%).
| Demographics | Rating | Rank | In Labor Force | Age 45-54 |
| Immigrants | Latin America | 0.0 /100 | #280 | Tragic 81.0% |
| Immigrants | Grenada | 0.0 /100 | #281 | Tragic 81.0% |
| Aleuts | 0.0 /100 | #282 | Tragic 81.0% |
| French American Indians | 0.0 /100 | #283 | Tragic 80.8% |
| Belizeans | 0.0 /100 | #284 | Tragic 80.8% |
| Delaware | 0.0 /100 | #285 | Tragic 80.8% |
| Immigrants | Dominica | 0.0 /100 | #286 | Tragic 80.8% |
| Vietnamese | 0.0 /100 | #287 | Tragic 80.8% |
| Cree | 0.0 /100 | #288 | Tragic 80.8% |
| Immigrants | Bangladesh | 0.0 /100 | #289 | Tragic 80.7% |
| Mexican American Indians | 0.0 /100 | #290 | Tragic 80.7% |
| Immigrants | Belize | 0.0 /100 | #291 | Tragic 80.6% |
| Iroquois | 0.0 /100 | #292 | Tragic 80.6% |
| Osage | 0.0 /100 | #293 | Tragic 80.6% |
| Yakama | 0.0 /100 | #294 | Tragic 80.6% |
Demographics Similar to Immigrants from Egypt by In Labor Force | Age 45-54
In terms of in labor force | age 45-54, the demographic groups most similar to Immigrants from Egypt are Russian (83.4%, a difference of 0.010%), Cuban (83.4%, a difference of 0.010%), Belgian (83.4%, a difference of 0.010%), Immigrants from Croatia (83.4%, a difference of 0.010%), and Jordanian (83.4%, a difference of 0.010%).
| Demographics | Rating | Rank | In Labor Force | Age 45-54 |
| Colombians | 97.3 /100 | #71 | Exceptional 83.4% |
| Serbians | 97.2 /100 | #72 | Exceptional 83.4% |
| Immigrants | Czechoslovakia | 97.1 /100 | #73 | Exceptional 83.4% |
| Immigrants | Somalia | 96.9 /100 | #74 | Exceptional 83.4% |
| Estonians | 96.9 /100 | #75 | Exceptional 83.4% |
| Russians | 96.8 /100 | #76 | Exceptional 83.4% |
| Cubans | 96.7 /100 | #77 | Exceptional 83.4% |
| Immigrants | Egypt | 96.6 /100 | #78 | Exceptional 83.4% |
| Belgians | 96.5 /100 | #79 | Exceptional 83.4% |
| Immigrants | Croatia | 96.5 /100 | #80 | Exceptional 83.4% |
| Jordanians | 96.4 /100 | #81 | Exceptional 83.4% |
| Immigrants | Eastern Asia | 96.3 /100 | #82 | Exceptional 83.4% |
| Immigrants | Zimbabwe | 96.3 /100 | #83 | Exceptional 83.4% |
| Immigrants | Bosnia and Herzegovina | 96.0 /100 | #84 | Exceptional 83.3% |
| Greeks | 95.9 /100 | #85 | Exceptional 83.3% |