Vietnamese vs Choctaw Receiving Food Stamps
COMPARE
Vietnamese
Choctaw
Receiving Food Stamps
Receiving Food Stamps Comparison
Vietnamese
Choctaw
15.7%
RECEIVING FOOD STAMPS
0.0/ 100
METRIC RATING
293rd/ 347
METRIC RANK
13.6%
RECEIVING FOOD STAMPS
1.0/ 100
METRIC RATING
241st/ 347
METRIC RANK
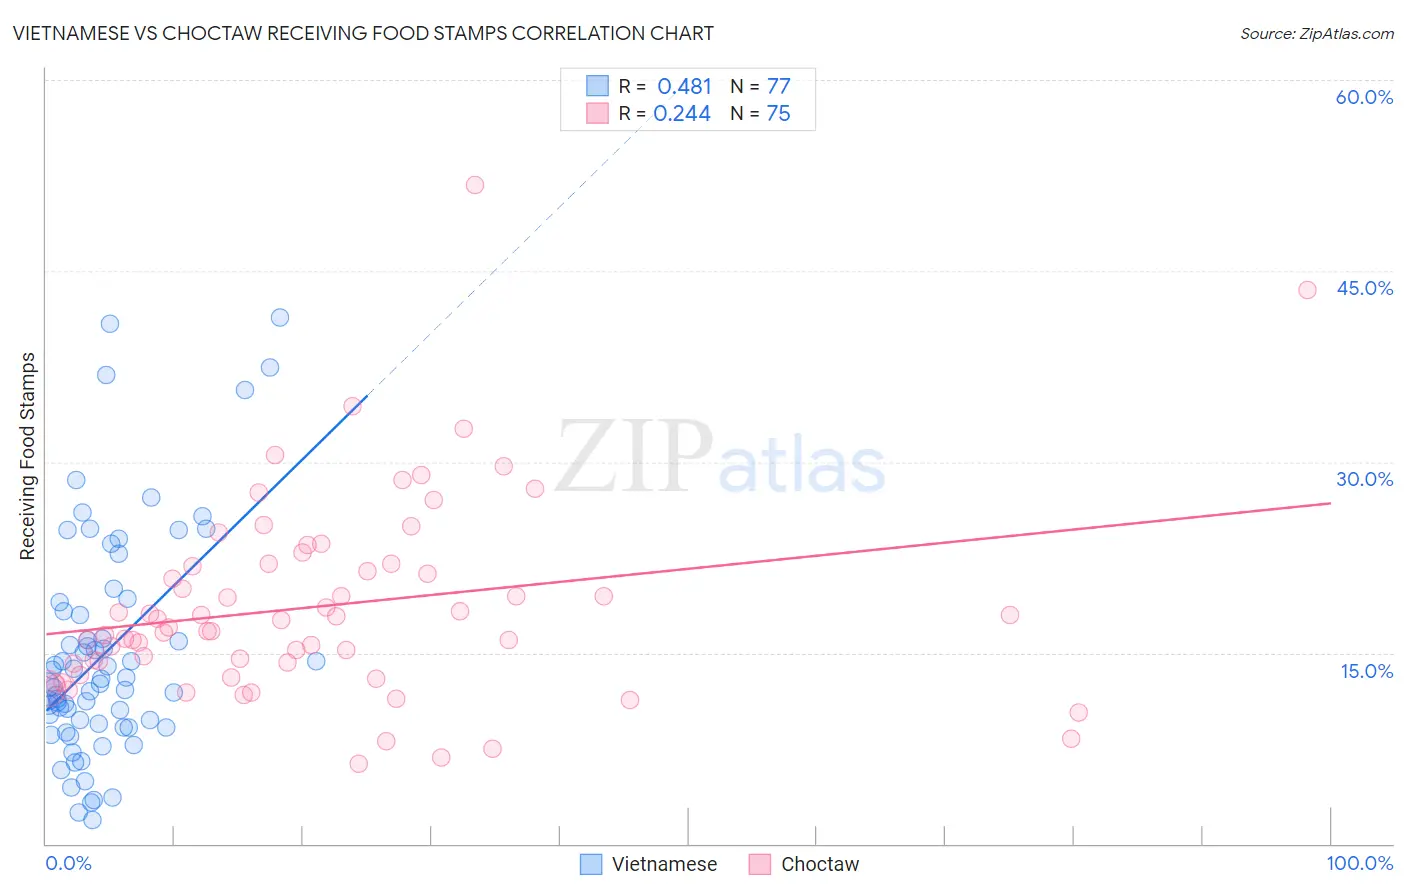
Vietnamese vs Choctaw Receiving Food Stamps Correlation Chart
The statistical analysis conducted on geographies consisting of 170,448,665 people shows a moderate positive correlation between the proportion of Vietnamese and percentage of population receiving government assistance and/or food stamps in the United States with a correlation coefficient (R) of 0.481 and weighted average of 15.7%. Similarly, the statistical analysis conducted on geographies consisting of 269,484,151 people shows a weak positive correlation between the proportion of Choctaw and percentage of population receiving government assistance and/or food stamps in the United States with a correlation coefficient (R) of 0.244 and weighted average of 13.6%, a difference of 15.1%.
Receiving Food Stamps Correlation Summary
| Measurement | Vietnamese | Choctaw |
| Minimum | 1.9% | 6.3% |
| Maximum | 41.3% | 51.8% |
| Range | 39.4% | 45.5% |
| Mean | 15.0% | 18.7% |
| Median | 12.6% | 17.0% |
| Interquartile 25% (IQ1) | 9.2% | 14.1% |
| Interquartile 75% (IQ3) | 18.6% | 22.0% |
| Interquartile Range (IQR) | 9.4% | 7.9% |
| Standard Deviation (Sample) | 8.8% | 7.8% |
| Standard Deviation (Population) | 8.8% | 7.8% |
Similar Demographics by Receiving Food Stamps
Demographics Similar to Vietnamese by Receiving Food Stamps
In terms of receiving food stamps, the demographic groups most similar to Vietnamese are Immigrants from Latin America (15.7%, a difference of 0.11%), Alaska Native (15.6%, a difference of 0.30%), Immigrants from Honduras (15.7%, a difference of 0.43%), Tsimshian (15.7%, a difference of 0.44%), and Immigrants from Bahamas (15.8%, a difference of 0.60%).
| Demographics | Rating | Rank | Receiving Food Stamps |
| Africans | 0.0 /100 | #286 | Tragic 15.1% |
| Immigrants | Mexico | 0.0 /100 | #287 | Tragic 15.2% |
| Immigrants | Belize | 0.0 /100 | #288 | Tragic 15.2% |
| Immigrants | Senegal | 0.0 /100 | #289 | Tragic 15.3% |
| Senegalese | 0.0 /100 | #290 | Tragic 15.4% |
| Hondurans | 0.0 /100 | #291 | Tragic 15.5% |
| Alaska Natives | 0.0 /100 | #292 | Tragic 15.6% |
| Vietnamese | 0.0 /100 | #293 | Tragic 15.7% |
| Immigrants | Latin America | 0.0 /100 | #294 | Tragic 15.7% |
| Immigrants | Honduras | 0.0 /100 | #295 | Tragic 15.7% |
| Tsimshian | 0.0 /100 | #296 | Tragic 15.7% |
| Immigrants | Bahamas | 0.0 /100 | #297 | Tragic 15.8% |
| Immigrants | Trinidad and Tobago | 0.0 /100 | #298 | Tragic 15.8% |
| Hispanics or Latinos | 0.0 /100 | #299 | Tragic 15.8% |
| Immigrants | Bangladesh | 0.0 /100 | #300 | Tragic 15.9% |
Demographics Similar to Choctaw by Receiving Food Stamps
In terms of receiving food stamps, the demographic groups most similar to Choctaw are Immigrants from Panama (13.6%, a difference of 0.18%), Somali (13.7%, a difference of 0.38%), Iroquois (13.5%, a difference of 0.43%), Cajun (13.7%, a difference of 0.54%), and Immigrants from Somalia (13.7%, a difference of 0.58%).
| Demographics | Rating | Rank | Receiving Food Stamps |
| Comanche | 2.4 /100 | #234 | Tragic 13.3% |
| Immigrants | Zaire | 1.9 /100 | #235 | Tragic 13.4% |
| Crow | 1.6 /100 | #236 | Tragic 13.4% |
| Immigrants | El Salvador | 1.5 /100 | #237 | Tragic 13.5% |
| French American Indians | 1.4 /100 | #238 | Tragic 13.5% |
| Immigrants | Micronesia | 1.3 /100 | #239 | Tragic 13.5% |
| Iroquois | 1.2 /100 | #240 | Tragic 13.5% |
| Choctaw | 1.0 /100 | #241 | Tragic 13.6% |
| Immigrants | Panama | 1.0 /100 | #242 | Tragic 13.6% |
| Somalis | 0.9 /100 | #243 | Tragic 13.7% |
| Cajuns | 0.9 /100 | #244 | Tragic 13.7% |
| Immigrants | Somalia | 0.9 /100 | #245 | Tragic 13.7% |
| Cree | 0.8 /100 | #246 | Tragic 13.7% |
| Mexican American Indians | 0.7 /100 | #247 | Tragic 13.8% |
| Immigrants | Laos | 0.7 /100 | #248 | Tragic 13.8% |