Vietnamese vs Immigrants from Yemen In Labor Force | Age 45-54
COMPARE
Vietnamese
Immigrants from Yemen
In Labor Force | Age 45-54
In Labor Force | Age 45-54 Comparison
Vietnamese
Immigrants from Yemen
80.8%
IN LABOR FORCE | AGE 45-54
0.0/ 100
METRIC RATING
287th/ 347
METRIC RANK
74.4%
IN LABOR FORCE | AGE 45-54
0.0/ 100
METRIC RATING
344th/ 347
METRIC RANK
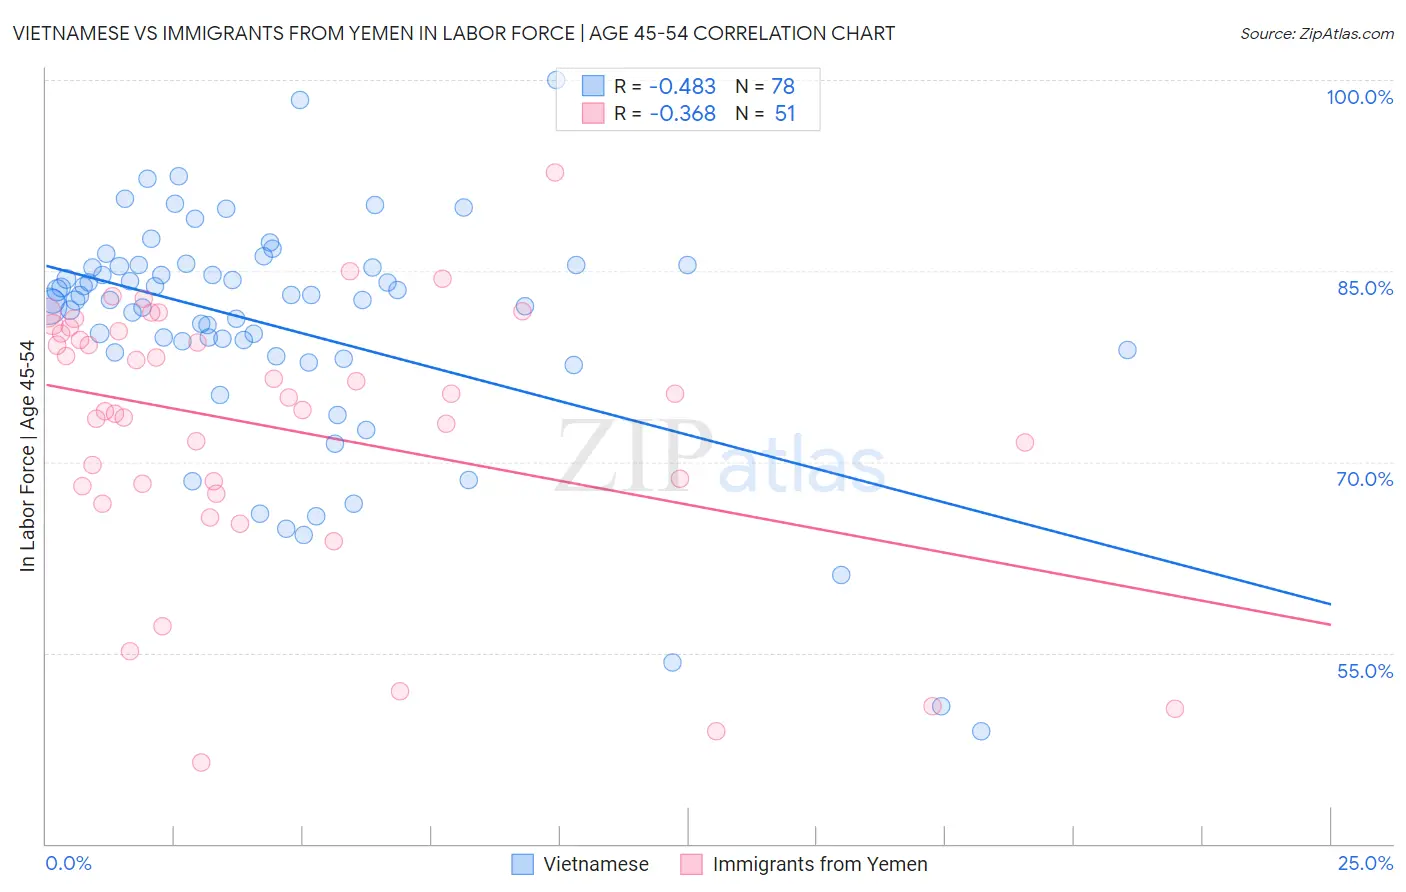
Vietnamese vs Immigrants from Yemen In Labor Force | Age 45-54 Correlation Chart
The statistical analysis conducted on geographies consisting of 170,653,074 people shows a moderate negative correlation between the proportion of Vietnamese and labor force participation rate among population between the ages 45 and 54 in the United States with a correlation coefficient (R) of -0.483 and weighted average of 80.8%. Similarly, the statistical analysis conducted on geographies consisting of 82,433,611 people shows a mild negative correlation between the proportion of Immigrants from Yemen and labor force participation rate among population between the ages 45 and 54 in the United States with a correlation coefficient (R) of -0.368 and weighted average of 74.4%, a difference of 8.5%.
In Labor Force | Age 45-54 Correlation Summary
| Measurement | Vietnamese | Immigrants from Yemen |
| Minimum | 48.8% | 46.4% |
| Maximum | 100.0% | 92.7% |
| Range | 51.2% | 46.3% |
| Mean | 80.5% | 72.7% |
| Median | 82.7% | 75.1% |
| Interquartile 25% (IQ1) | 78.6% | 68.1% |
| Interquartile 75% (IQ3) | 85.3% | 80.3% |
| Interquartile Range (IQR) | 6.8% | 12.2% |
| Standard Deviation (Sample) | 9.4% | 10.4% |
| Standard Deviation (Population) | 9.3% | 10.3% |
Similar Demographics by In Labor Force | Age 45-54
Demographics Similar to Vietnamese by In Labor Force | Age 45-54
In terms of in labor force | age 45-54, the demographic groups most similar to Vietnamese are Immigrants from Dominica (80.8%, a difference of 0.0%), Cree (80.8%, a difference of 0.0%), Delaware (80.8%, a difference of 0.010%), Belizean (80.8%, a difference of 0.020%), and Immigrants from Bangladesh (80.7%, a difference of 0.030%).
| Demographics | Rating | Rank | In Labor Force | Age 45-54 |
| Immigrants | Latin America | 0.0 /100 | #280 | Tragic 81.0% |
| Immigrants | Grenada | 0.0 /100 | #281 | Tragic 81.0% |
| Aleuts | 0.0 /100 | #282 | Tragic 81.0% |
| French American Indians | 0.0 /100 | #283 | Tragic 80.8% |
| Belizeans | 0.0 /100 | #284 | Tragic 80.8% |
| Delaware | 0.0 /100 | #285 | Tragic 80.8% |
| Immigrants | Dominica | 0.0 /100 | #286 | Tragic 80.8% |
| Vietnamese | 0.0 /100 | #287 | Tragic 80.8% |
| Cree | 0.0 /100 | #288 | Tragic 80.8% |
| Immigrants | Bangladesh | 0.0 /100 | #289 | Tragic 80.7% |
| Mexican American Indians | 0.0 /100 | #290 | Tragic 80.7% |
| Immigrants | Belize | 0.0 /100 | #291 | Tragic 80.6% |
| Iroquois | 0.0 /100 | #292 | Tragic 80.6% |
| Osage | 0.0 /100 | #293 | Tragic 80.6% |
| Yakama | 0.0 /100 | #294 | Tragic 80.6% |
Demographics Similar to Immigrants from Yemen by In Labor Force | Age 45-54
In terms of in labor force | age 45-54, the demographic groups most similar to Immigrants from Yemen are Houma (74.1%, a difference of 0.48%), Hopi (75.0%, a difference of 0.78%), Tohono O'odham (75.1%, a difference of 0.96%), Pueblo (75.5%, a difference of 1.5%), and Lumbee (75.6%, a difference of 1.6%).
| Demographics | Rating | Rank | In Labor Force | Age 45-54 |
| Natives/Alaskans | 0.0 /100 | #333 | Tragic 77.1% |
| Apache | 0.0 /100 | #334 | Tragic 77.1% |
| Arapaho | 0.0 /100 | #335 | Tragic 77.1% |
| Paiute | 0.0 /100 | #336 | Tragic 76.7% |
| Ute | 0.0 /100 | #337 | Tragic 76.6% |
| Yuman | 0.0 /100 | #338 | Tragic 76.3% |
| Puerto Ricans | 0.0 /100 | #339 | Tragic 75.9% |
| Lumbee | 0.0 /100 | #340 | Tragic 75.6% |
| Pueblo | 0.0 /100 | #341 | Tragic 75.5% |
| Tohono O'odham | 0.0 /100 | #342 | Tragic 75.1% |
| Hopi | 0.0 /100 | #343 | Tragic 75.0% |
| Immigrants | Yemen | 0.0 /100 | #344 | Tragic 74.4% |
| Houma | 0.0 /100 | #345 | Tragic 74.1% |
| Pima | 0.0 /100 | #346 | Tragic 72.8% |
| Navajo | 0.0 /100 | #347 | Tragic 72.8% |