Immigrants from Sudan vs Choctaw In Labor Force | Age 45-54
COMPARE
Immigrants from Sudan
Choctaw
In Labor Force | Age 45-54
In Labor Force | Age 45-54 Comparison
Immigrants from Sudan
Choctaw
82.8%
IN LABOR FORCE | AGE 45-54
59.9/ 100
METRIC RATING
165th/ 347
METRIC RANK
78.2%
IN LABOR FORCE | AGE 45-54
0.0/ 100
METRIC RATING
325th/ 347
METRIC RANK
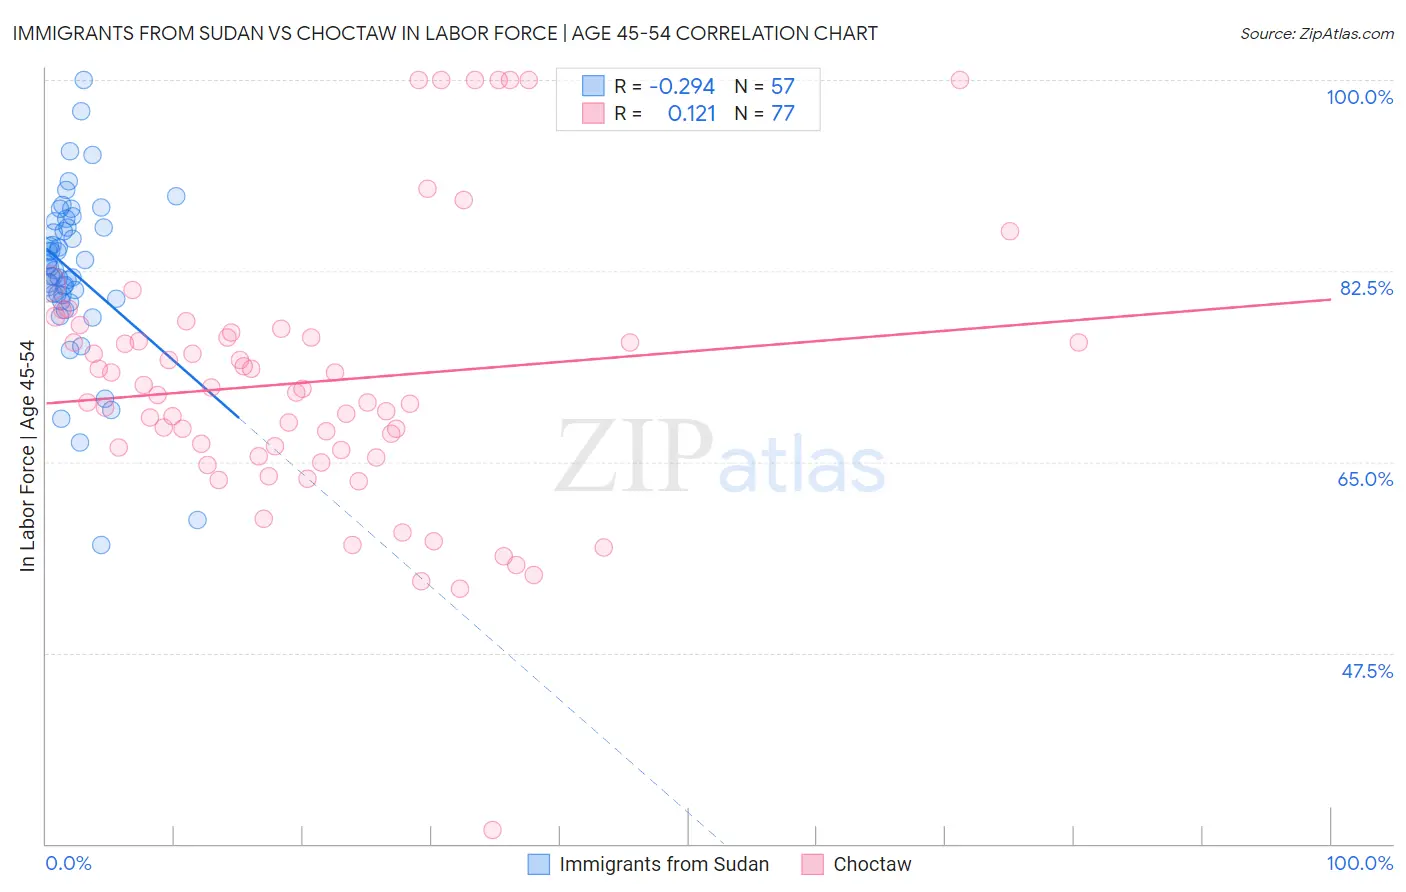
Immigrants from Sudan vs Choctaw In Labor Force | Age 45-54 Correlation Chart
The statistical analysis conducted on geographies consisting of 118,941,177 people shows a weak negative correlation between the proportion of Immigrants from Sudan and labor force participation rate among population between the ages 45 and 54 in the United States with a correlation coefficient (R) of -0.294 and weighted average of 82.8%. Similarly, the statistical analysis conducted on geographies consisting of 269,621,140 people shows a poor positive correlation between the proportion of Choctaw and labor force participation rate among population between the ages 45 and 54 in the United States with a correlation coefficient (R) of 0.121 and weighted average of 78.2%, a difference of 6.0%.
In Labor Force | Age 45-54 Correlation Summary
| Measurement | Immigrants from Sudan | Choctaw |
| Minimum | 57.4% | 31.3% |
| Maximum | 100.0% | 100.0% |
| Range | 42.6% | 68.7% |
| Mean | 82.4% | 72.4% |
| Median | 82.8% | 71.3% |
| Interquartile 25% (IQ1) | 80.2% | 65.8% |
| Interquartile 75% (IQ3) | 86.8% | 76.6% |
| Interquartile Range (IQR) | 6.6% | 10.8% |
| Standard Deviation (Sample) | 7.7% | 12.4% |
| Standard Deviation (Population) | 7.6% | 12.3% |
Similar Demographics by In Labor Force | Age 45-54
Demographics Similar to Immigrants from Sudan by In Labor Force | Age 45-54
In terms of in labor force | age 45-54, the demographic groups most similar to Immigrants from Sudan are German Russian (82.8%, a difference of 0.010%), South American Indian (82.9%, a difference of 0.020%), Haitian (82.8%, a difference of 0.020%), Dutch (82.8%, a difference of 0.020%), and Immigrants from South Eastern Asia (82.8%, a difference of 0.020%).
| Demographics | Rating | Rank | In Labor Force | Age 45-54 |
| Immigrants | Southern Europe | 67.8 /100 | #158 | Good 82.9% |
| Immigrants | Austria | 64.6 /100 | #159 | Good 82.9% |
| Laotians | 62.8 /100 | #160 | Good 82.9% |
| South American Indians | 62.2 /100 | #161 | Good 82.9% |
| Haitians | 61.8 /100 | #162 | Good 82.8% |
| Dutch | 61.7 /100 | #163 | Good 82.8% |
| German Russians | 61.3 /100 | #164 | Good 82.8% |
| Immigrants | Sudan | 59.9 /100 | #165 | Average 82.8% |
| Immigrants | South Eastern Asia | 57.4 /100 | #166 | Average 82.8% |
| Swiss | 56.5 /100 | #167 | Average 82.8% |
| Immigrants | South Africa | 55.8 /100 | #168 | Average 82.8% |
| Immigrants | Western Africa | 54.1 /100 | #169 | Average 82.8% |
| Pakistanis | 53.2 /100 | #170 | Average 82.8% |
| Immigrants | Zaire | 52.9 /100 | #171 | Average 82.8% |
| Icelanders | 51.8 /100 | #172 | Average 82.8% |
Demographics Similar to Choctaw by In Labor Force | Age 45-54
In terms of in labor force | age 45-54, the demographic groups most similar to Choctaw are Seminole (78.1%, a difference of 0.050%), Cajun (78.1%, a difference of 0.050%), Dutch West Indian (78.2%, a difference of 0.090%), Kiowa (78.3%, a difference of 0.11%), and Crow (78.3%, a difference of 0.20%).
| Demographics | Rating | Rank | In Labor Force | Age 45-54 |
| Chickasaw | 0.0 /100 | #318 | Tragic 79.0% |
| Cherokee | 0.0 /100 | #319 | Tragic 79.0% |
| Yaqui | 0.0 /100 | #320 | Tragic 78.9% |
| Yup'ik | 0.0 /100 | #321 | Tragic 78.6% |
| Crow | 0.0 /100 | #322 | Tragic 78.3% |
| Kiowa | 0.0 /100 | #323 | Tragic 78.3% |
| Dutch West Indians | 0.0 /100 | #324 | Tragic 78.2% |
| Choctaw | 0.0 /100 | #325 | Tragic 78.2% |
| Seminole | 0.0 /100 | #326 | Tragic 78.1% |
| Cajuns | 0.0 /100 | #327 | Tragic 78.1% |
| Sioux | 0.0 /100 | #328 | Tragic 78.0% |
| Creek | 0.0 /100 | #329 | Tragic 77.7% |
| Cheyenne | 0.0 /100 | #330 | Tragic 77.6% |
| Tsimshian | 0.0 /100 | #331 | Tragic 77.4% |
| Menominee | 0.0 /100 | #332 | Tragic 77.4% |