Venezuelan vs Paiute In Labor Force | Age > 16
COMPARE
Venezuelan
Paiute
In Labor Force | Age > 16
In Labor Force | Age > 16 Comparison
Venezuelans
Paiute
66.3%
IN LABOR FORCE | AGE > 16
99.8/ 100
METRIC RATING
63rd/ 347
METRIC RANK
60.7%
IN LABOR FORCE | AGE > 16
0.0/ 100
METRIC RATING
333rd/ 347
METRIC RANK
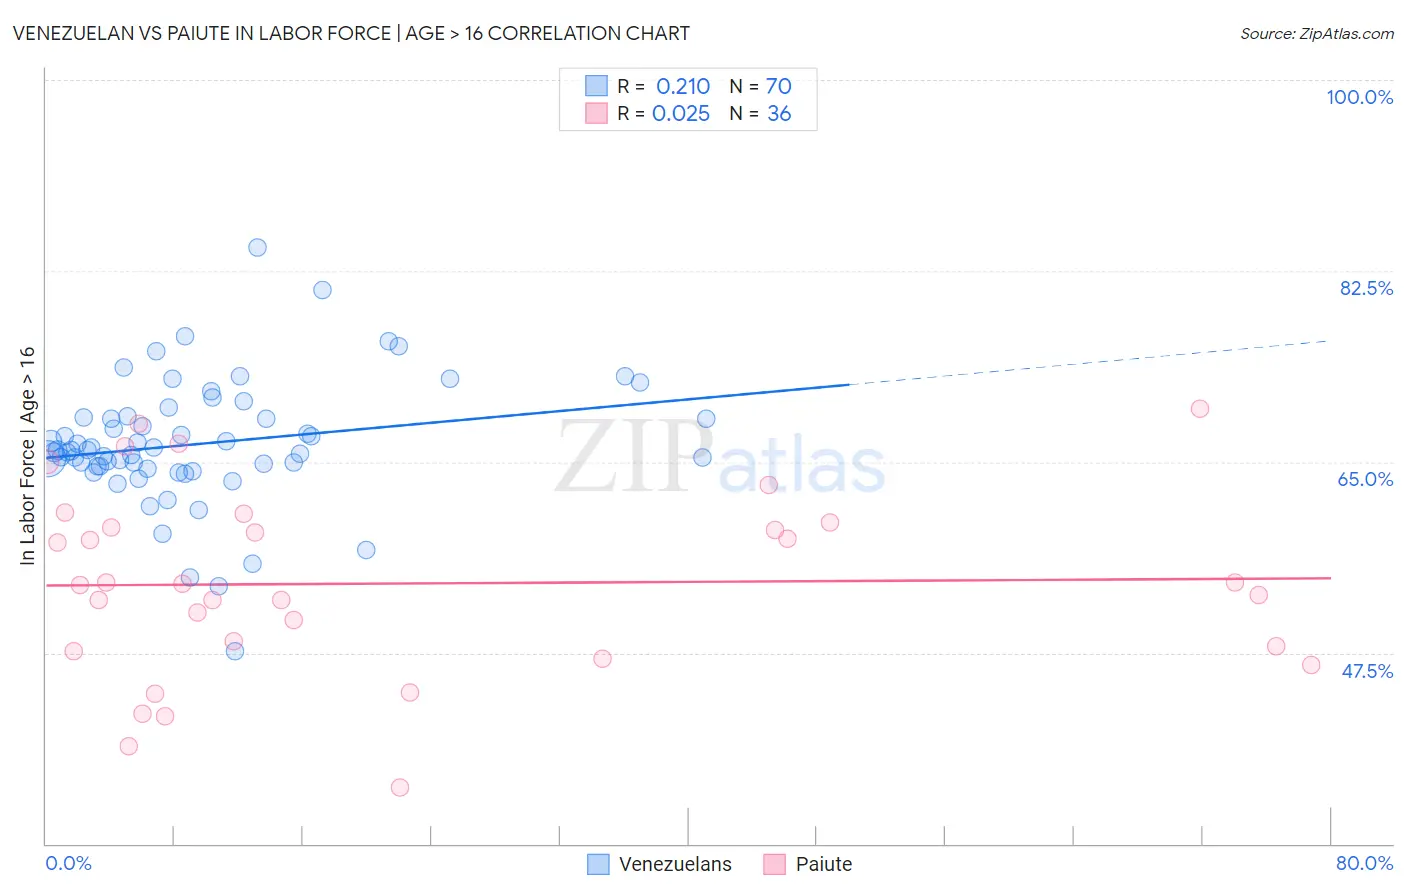
Venezuelan vs Paiute In Labor Force | Age > 16 Correlation Chart
The statistical analysis conducted on geographies consisting of 306,338,840 people shows a weak positive correlation between the proportion of Venezuelans and labor force participation rate among population ages 16 and over in the United States with a correlation coefficient (R) of 0.210 and weighted average of 66.3%. Similarly, the statistical analysis conducted on geographies consisting of 58,401,251 people shows no correlation between the proportion of Paiute and labor force participation rate among population ages 16 and over in the United States with a correlation coefficient (R) of 0.025 and weighted average of 60.7%, a difference of 9.1%.
In Labor Force | Age > 16 Correlation Summary
| Measurement | Venezuelan | Paiute |
| Minimum | 47.6% | 35.1% |
| Maximum | 84.7% | 69.9% |
| Range | 37.1% | 34.8% |
| Mean | 66.7% | 53.9% |
| Median | 66.1% | 53.7% |
| Interquartile 25% (IQ1) | 64.6% | 47.9% |
| Interquartile 75% (IQ3) | 69.1% | 59.2% |
| Interquartile Range (IQR) | 4.5% | 11.4% |
| Standard Deviation (Sample) | 5.8% | 8.5% |
| Standard Deviation (Population) | 5.8% | 8.4% |
Similar Demographics by In Labor Force | Age > 16
Demographics Similar to Venezuelans by In Labor Force | Age > 16
In terms of in labor force | age > 16, the demographic groups most similar to Venezuelans are Peruvian (66.3%, a difference of 0.0%), Sri Lankan (66.3%, a difference of 0.010%), Jordanian (66.3%, a difference of 0.030%), Immigrants from Peru (66.3%, a difference of 0.040%), and Immigrants from Burma/Myanmar (66.3%, a difference of 0.040%).
| Demographics | Rating | Rank | In Labor Force | Age > 16 |
| Immigrants | Senegal | 99.9 /100 | #56 | Exceptional 66.4% |
| Bulgarians | 99.9 /100 | #57 | Exceptional 66.4% |
| Immigrants | Saudi Arabia | 99.9 /100 | #58 | Exceptional 66.3% |
| Immigrants | Turkey | 99.9 /100 | #59 | Exceptional 66.3% |
| Immigrants | Peru | 99.8 /100 | #60 | Exceptional 66.3% |
| Immigrants | Burma/Myanmar | 99.8 /100 | #61 | Exceptional 66.3% |
| Indonesians | 99.8 /100 | #62 | Exceptional 66.3% |
| Venezuelans | 99.8 /100 | #63 | Exceptional 66.3% |
| Peruvians | 99.8 /100 | #64 | Exceptional 66.3% |
| Sri Lankans | 99.8 /100 | #65 | Exceptional 66.3% |
| Jordanians | 99.8 /100 | #66 | Exceptional 66.3% |
| Egyptians | 99.8 /100 | #67 | Exceptional 66.2% |
| Immigrants | Egypt | 99.7 /100 | #68 | Exceptional 66.2% |
| Sub-Saharan Africans | 99.7 /100 | #69 | Exceptional 66.2% |
| Asians | 99.7 /100 | #70 | Exceptional 66.2% |
Demographics Similar to Paiute by In Labor Force | Age > 16
In terms of in labor force | age > 16, the demographic groups most similar to Paiute are Apache (60.7%, a difference of 0.050%), Crow (60.8%, a difference of 0.080%), Native/Alaskan (60.6%, a difference of 0.23%), Ute (60.9%, a difference of 0.26%), and Menominee (60.6%, a difference of 0.26%).
| Demographics | Rating | Rank | In Labor Force | Age > 16 |
| Sioux | 0.0 /100 | #326 | Tragic 61.8% |
| Cajuns | 0.0 /100 | #327 | Tragic 61.8% |
| Dutch West Indians | 0.0 /100 | #328 | Tragic 61.7% |
| Choctaw | 0.0 /100 | #329 | Tragic 61.5% |
| Creek | 0.0 /100 | #330 | Tragic 61.3% |
| Ute | 0.0 /100 | #331 | Tragic 60.9% |
| Crow | 0.0 /100 | #332 | Tragic 60.8% |
| Paiute | 0.0 /100 | #333 | Tragic 60.7% |
| Apache | 0.0 /100 | #334 | Tragic 60.7% |
| Natives/Alaskans | 0.0 /100 | #335 | Tragic 60.6% |
| Menominee | 0.0 /100 | #336 | Tragic 60.6% |
| Colville | 0.0 /100 | #337 | Tragic 59.8% |
| Immigrants | Yemen | 0.0 /100 | #338 | Tragic 59.6% |
| Houma | 0.0 /100 | #339 | Tragic 59.5% |
| Pueblo | 0.0 /100 | #340 | Tragic 59.3% |