Venezuelan vs Immigrants from Norway In Labor Force | Age > 16
COMPARE
Venezuelan
Immigrants from Norway
In Labor Force | Age > 16
In Labor Force | Age > 16 Comparison
Venezuelans
Immigrants from Norway
66.3%
IN LABOR FORCE | AGE > 16
99.8/ 100
METRIC RATING
63rd/ 347
METRIC RANK
64.6%
IN LABOR FORCE | AGE > 16
4.6/ 100
METRIC RATING
236th/ 347
METRIC RANK
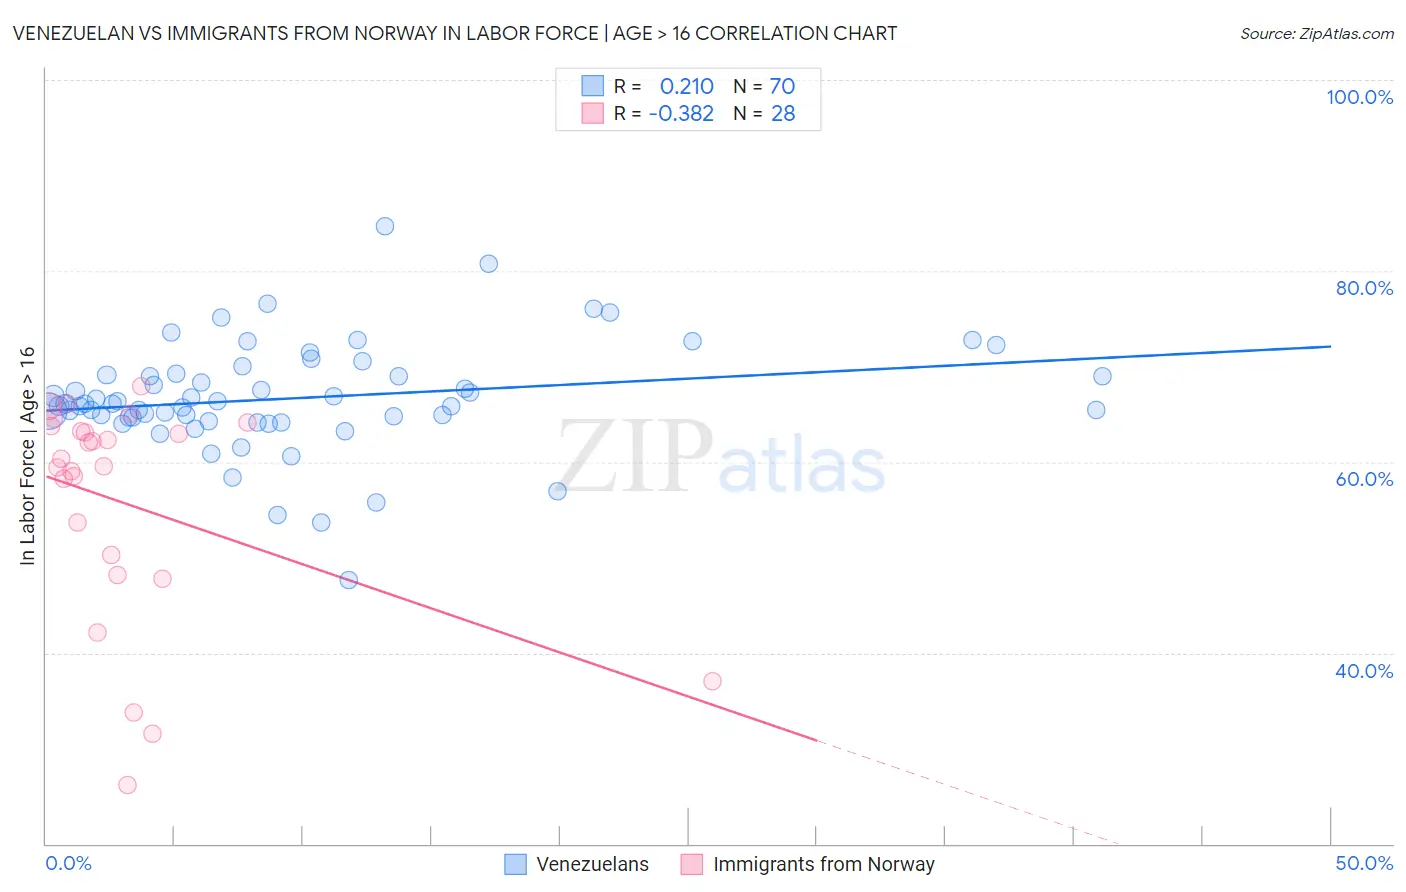
Venezuelan vs Immigrants from Norway In Labor Force | Age > 16 Correlation Chart
The statistical analysis conducted on geographies consisting of 306,338,840 people shows a weak positive correlation between the proportion of Venezuelans and labor force participation rate among population ages 16 and over in the United States with a correlation coefficient (R) of 0.210 and weighted average of 66.3%. Similarly, the statistical analysis conducted on geographies consisting of 116,717,057 people shows a mild negative correlation between the proportion of Immigrants from Norway and labor force participation rate among population ages 16 and over in the United States with a correlation coefficient (R) of -0.382 and weighted average of 64.6%, a difference of 2.6%.
In Labor Force | Age > 16 Correlation Summary
| Measurement | Venezuelan | Immigrants from Norway |
| Minimum | 47.6% | 26.2% |
| Maximum | 84.7% | 67.9% |
| Range | 37.1% | 41.7% |
| Mean | 66.7% | 55.7% |
| Median | 66.1% | 59.9% |
| Interquartile 25% (IQ1) | 64.6% | 49.1% |
| Interquartile 75% (IQ3) | 69.1% | 63.5% |
| Interquartile Range (IQR) | 4.5% | 14.4% |
| Standard Deviation (Sample) | 5.8% | 11.6% |
| Standard Deviation (Population) | 5.8% | 11.4% |
Similar Demographics by In Labor Force | Age > 16
Demographics Similar to Venezuelans by In Labor Force | Age > 16
In terms of in labor force | age > 16, the demographic groups most similar to Venezuelans are Peruvian (66.3%, a difference of 0.0%), Sri Lankan (66.3%, a difference of 0.010%), Jordanian (66.3%, a difference of 0.030%), Immigrants from Peru (66.3%, a difference of 0.040%), and Immigrants from Burma/Myanmar (66.3%, a difference of 0.040%).
| Demographics | Rating | Rank | In Labor Force | Age > 16 |
| Immigrants | Senegal | 99.9 /100 | #56 | Exceptional 66.4% |
| Bulgarians | 99.9 /100 | #57 | Exceptional 66.4% |
| Immigrants | Saudi Arabia | 99.9 /100 | #58 | Exceptional 66.3% |
| Immigrants | Turkey | 99.9 /100 | #59 | Exceptional 66.3% |
| Immigrants | Peru | 99.8 /100 | #60 | Exceptional 66.3% |
| Immigrants | Burma/Myanmar | 99.8 /100 | #61 | Exceptional 66.3% |
| Indonesians | 99.8 /100 | #62 | Exceptional 66.3% |
| Venezuelans | 99.8 /100 | #63 | Exceptional 66.3% |
| Peruvians | 99.8 /100 | #64 | Exceptional 66.3% |
| Sri Lankans | 99.8 /100 | #65 | Exceptional 66.3% |
| Jordanians | 99.8 /100 | #66 | Exceptional 66.3% |
| Egyptians | 99.8 /100 | #67 | Exceptional 66.2% |
| Immigrants | Egypt | 99.7 /100 | #68 | Exceptional 66.2% |
| Sub-Saharan Africans | 99.7 /100 | #69 | Exceptional 66.2% |
| Asians | 99.7 /100 | #70 | Exceptional 66.2% |
Demographics Similar to Immigrants from Norway by In Labor Force | Age > 16
In terms of in labor force | age > 16, the demographic groups most similar to Immigrants from Norway are Vietnamese (64.6%, a difference of 0.0%), Austrian (64.6%, a difference of 0.0%), Italian (64.6%, a difference of 0.0%), Slavic (64.6%, a difference of 0.020%), and Lebanese (64.5%, a difference of 0.050%).
| Demographics | Rating | Rank | In Labor Force | Age > 16 |
| British | 7.3 /100 | #229 | Tragic 64.7% |
| Chinese | 7.3 /100 | #230 | Tragic 64.7% |
| Immigrants | Northern Europe | 7.2 /100 | #231 | Tragic 64.7% |
| Africans | 5.8 /100 | #232 | Tragic 64.6% |
| Slavs | 4.9 /100 | #233 | Tragic 64.6% |
| Vietnamese | 4.7 /100 | #234 | Tragic 64.6% |
| Austrians | 4.6 /100 | #235 | Tragic 64.6% |
| Immigrants | Norway | 4.6 /100 | #236 | Tragic 64.6% |
| Italians | 4.6 /100 | #237 | Tragic 64.6% |
| Lebanese | 3.9 /100 | #238 | Tragic 64.5% |
| Immigrants | Hungary | 3.8 /100 | #239 | Tragic 64.5% |
| Immigrants | Bangladesh | 3.6 /100 | #240 | Tragic 64.5% |
| Immigrants | Dominica | 3.5 /100 | #241 | Tragic 64.5% |
| Immigrants | Netherlands | 3.4 /100 | #242 | Tragic 64.5% |
| Immigrants | Lebanon | 3.2 /100 | #243 | Tragic 64.5% |