Venezuelan vs Immigrants from Cambodia In Labor Force | Age > 16
COMPARE
Venezuelan
Immigrants from Cambodia
In Labor Force | Age > 16
In Labor Force | Age > 16 Comparison
Venezuelans
Immigrants from Cambodia
66.3%
IN LABOR FORCE | AGE > 16
99.8/ 100
METRIC RATING
63rd/ 347
METRIC RANK
66.0%
IN LABOR FORCE | AGE > 16
99.1/ 100
METRIC RATING
94th/ 347
METRIC RANK
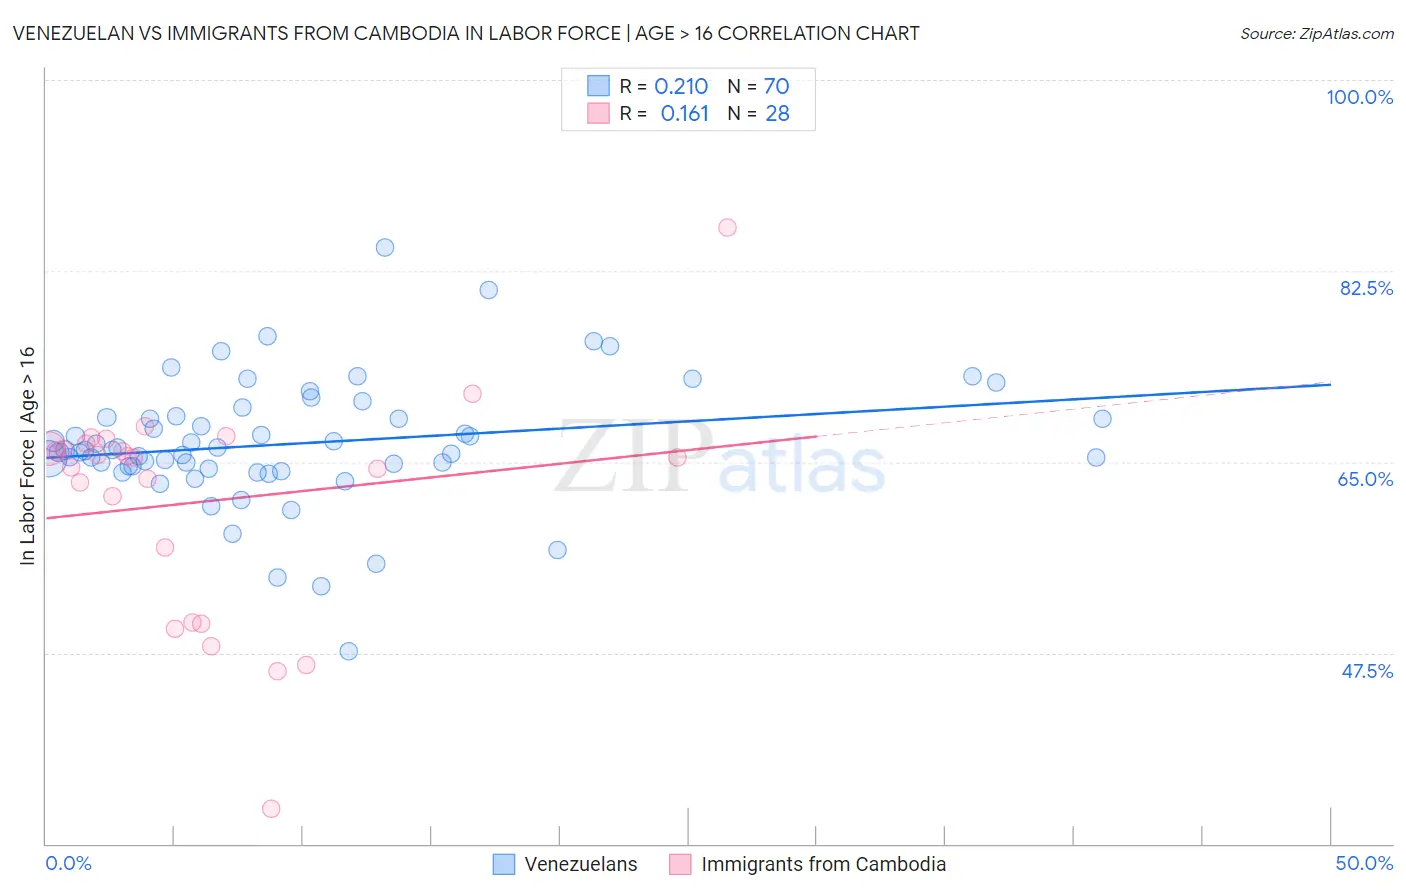
Venezuelan vs Immigrants from Cambodia In Labor Force | Age > 16 Correlation Chart
The statistical analysis conducted on geographies consisting of 306,338,840 people shows a weak positive correlation between the proportion of Venezuelans and labor force participation rate among population ages 16 and over in the United States with a correlation coefficient (R) of 0.210 and weighted average of 66.3%. Similarly, the statistical analysis conducted on geographies consisting of 205,156,117 people shows a poor positive correlation between the proportion of Immigrants from Cambodia and labor force participation rate among population ages 16 and over in the United States with a correlation coefficient (R) of 0.161 and weighted average of 66.0%, a difference of 0.46%.
In Labor Force | Age > 16 Correlation Summary
| Measurement | Venezuelan | Immigrants from Cambodia |
| Minimum | 47.6% | 33.2% |
| Maximum | 84.7% | 86.5% |
| Range | 37.1% | 53.3% |
| Mean | 66.7% | 61.4% |
| Median | 66.1% | 65.4% |
| Interquartile 25% (IQ1) | 64.6% | 53.7% |
| Interquartile 75% (IQ3) | 69.1% | 66.4% |
| Interquartile Range (IQR) | 4.5% | 12.8% |
| Standard Deviation (Sample) | 5.8% | 10.4% |
| Standard Deviation (Population) | 5.8% | 10.2% |
Similar Demographics by In Labor Force | Age > 16
Demographics Similar to Venezuelans by In Labor Force | Age > 16
In terms of in labor force | age > 16, the demographic groups most similar to Venezuelans are Peruvian (66.3%, a difference of 0.0%), Sri Lankan (66.3%, a difference of 0.010%), Jordanian (66.3%, a difference of 0.030%), Immigrants from Peru (66.3%, a difference of 0.040%), and Immigrants from Burma/Myanmar (66.3%, a difference of 0.040%).
| Demographics | Rating | Rank | In Labor Force | Age > 16 |
| Immigrants | Senegal | 99.9 /100 | #56 | Exceptional 66.4% |
| Bulgarians | 99.9 /100 | #57 | Exceptional 66.4% |
| Immigrants | Saudi Arabia | 99.9 /100 | #58 | Exceptional 66.3% |
| Immigrants | Turkey | 99.9 /100 | #59 | Exceptional 66.3% |
| Immigrants | Peru | 99.8 /100 | #60 | Exceptional 66.3% |
| Immigrants | Burma/Myanmar | 99.8 /100 | #61 | Exceptional 66.3% |
| Indonesians | 99.8 /100 | #62 | Exceptional 66.3% |
| Venezuelans | 99.8 /100 | #63 | Exceptional 66.3% |
| Peruvians | 99.8 /100 | #64 | Exceptional 66.3% |
| Sri Lankans | 99.8 /100 | #65 | Exceptional 66.3% |
| Jordanians | 99.8 /100 | #66 | Exceptional 66.3% |
| Egyptians | 99.8 /100 | #67 | Exceptional 66.2% |
| Immigrants | Egypt | 99.7 /100 | #68 | Exceptional 66.2% |
| Sub-Saharan Africans | 99.7 /100 | #69 | Exceptional 66.2% |
| Asians | 99.7 /100 | #70 | Exceptional 66.2% |
Demographics Similar to Immigrants from Cambodia by In Labor Force | Age > 16
In terms of in labor force | age > 16, the demographic groups most similar to Immigrants from Cambodia are Immigrants from Uruguay (66.0%, a difference of 0.0%), Aleut (66.0%, a difference of 0.020%), Immigrants from South America (66.0%, a difference of 0.020%), Iranian (66.0%, a difference of 0.040%), and Immigrants from Laos (66.0%, a difference of 0.050%).
| Demographics | Rating | Rank | In Labor Force | Age > 16 |
| South American Indians | 99.4 /100 | #87 | Exceptional 66.0% |
| Bermudans | 99.3 /100 | #88 | Exceptional 66.0% |
| Immigrants | Laos | 99.2 /100 | #89 | Exceptional 66.0% |
| Chileans | 99.2 /100 | #90 | Exceptional 66.0% |
| Iranians | 99.2 /100 | #91 | Exceptional 66.0% |
| Aleuts | 99.1 /100 | #92 | Exceptional 66.0% |
| Immigrants | South America | 99.1 /100 | #93 | Exceptional 66.0% |
| Immigrants | Cambodia | 99.1 /100 | #94 | Exceptional 66.0% |
| Immigrants | Uruguay | 99.1 /100 | #95 | Exceptional 66.0% |
| Bangladeshis | 98.9 /100 | #96 | Exceptional 65.9% |
| Filipinos | 98.9 /100 | #97 | Exceptional 65.9% |
| Immigrants | Chile | 98.7 /100 | #98 | Exceptional 65.9% |
| Immigrants | Australia | 98.7 /100 | #99 | Exceptional 65.9% |
| Okinawans | 98.7 /100 | #100 | Exceptional 65.9% |
| Immigrants | Colombia | 98.6 /100 | #101 | Exceptional 65.9% |