Costa Rican vs Dominican In Labor Force | Age 35-44
COMPARE
Costa Rican
Dominican
In Labor Force | Age 35-44
In Labor Force | Age 35-44 Comparison
Costa Ricans
Dominicans
84.3%
IN LABOR FORCE | AGE 35-44
35.3/ 100
METRIC RATING
185th/ 347
METRIC RANK
83.1%
IN LABOR FORCE | AGE 35-44
0.0/ 100
METRIC RATING
280th/ 347
METRIC RANK
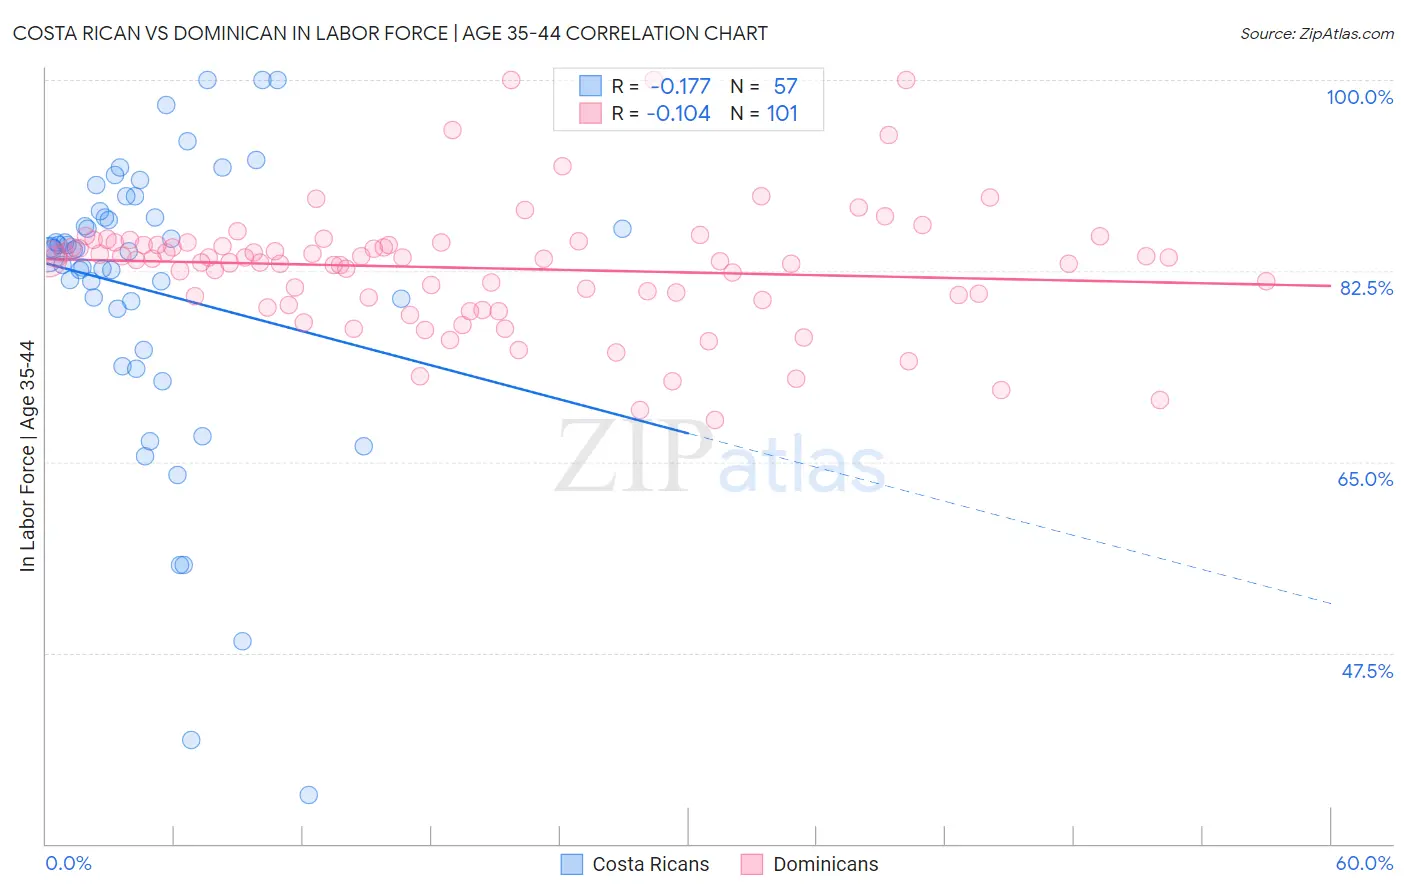
Costa Rican vs Dominican In Labor Force | Age 35-44 Correlation Chart
The statistical analysis conducted on geographies consisting of 253,534,047 people shows a poor negative correlation between the proportion of Costa Ricans and labor force participation rate among population between the ages 35 and 44 in the United States with a correlation coefficient (R) of -0.177 and weighted average of 84.3%. Similarly, the statistical analysis conducted on geographies consisting of 354,840,200 people shows a poor negative correlation between the proportion of Dominicans and labor force participation rate among population between the ages 35 and 44 in the United States with a correlation coefficient (R) of -0.104 and weighted average of 83.1%, a difference of 1.4%.
In Labor Force | Age 35-44 Correlation Summary
| Measurement | Costa Rican | Dominican |
| Minimum | 34.5% | 68.8% |
| Maximum | 100.0% | 100.0% |
| Range | 65.5% | 31.2% |
| Mean | 80.6% | 82.8% |
| Median | 84.4% | 83.7% |
| Interquartile 25% (IQ1) | 77.2% | 80.0% |
| Interquartile 75% (IQ3) | 87.7% | 85.0% |
| Interquartile Range (IQR) | 10.6% | 5.0% |
| Standard Deviation (Sample) | 13.6% | 5.7% |
| Standard Deviation (Population) | 13.5% | 5.6% |
Similar Demographics by In Labor Force | Age 35-44
Demographics Similar to Costa Ricans by In Labor Force | Age 35-44
In terms of in labor force | age 35-44, the demographic groups most similar to Costa Ricans are Armenian (84.3%, a difference of 0.0%), Australian (84.3%, a difference of 0.0%), Dutch (84.3%, a difference of 0.0%), Immigrants from West Indies (84.3%, a difference of 0.010%), and Korean (84.3%, a difference of 0.010%).
| Demographics | Rating | Rank | In Labor Force | Age 35-44 |
| Northern Europeans | 44.1 /100 | #178 | Average 84.3% |
| Immigrants | South Africa | 42.8 /100 | #179 | Average 84.3% |
| Danes | 38.8 /100 | #180 | Fair 84.3% |
| Immigrants | West Indies | 36.4 /100 | #181 | Fair 84.3% |
| Koreans | 36.3 /100 | #182 | Fair 84.3% |
| Barbadians | 36.2 /100 | #183 | Fair 84.3% |
| Armenians | 35.6 /100 | #184 | Fair 84.3% |
| Costa Ricans | 35.3 /100 | #185 | Fair 84.3% |
| Australians | 35.1 /100 | #186 | Fair 84.3% |
| Dutch | 34.8 /100 | #187 | Fair 84.3% |
| South Africans | 34.1 /100 | #188 | Fair 84.3% |
| Immigrants | Denmark | 33.7 /100 | #189 | Fair 84.3% |
| Portuguese | 31.9 /100 | #190 | Fair 84.3% |
| Immigrants | Philippines | 27.9 /100 | #191 | Fair 84.2% |
| Immigrants | Vietnam | 27.4 /100 | #192 | Fair 84.2% |
Demographics Similar to Dominicans by In Labor Force | Age 35-44
In terms of in labor force | age 35-44, the demographic groups most similar to Dominicans are Immigrants from Micronesia (83.1%, a difference of 0.040%), Belizean (83.1%, a difference of 0.050%), Delaware (83.2%, a difference of 0.13%), Samoan (83.2%, a difference of 0.13%), and Guatemalan (83.0%, a difference of 0.13%).
| Demographics | Rating | Rank | In Labor Force | Age 35-44 |
| Spanish | 0.0 /100 | #273 | Tragic 83.2% |
| Immigrants | Nonimmigrants | 0.0 /100 | #274 | Tragic 83.2% |
| Hawaiians | 0.0 /100 | #275 | Tragic 83.2% |
| Delaware | 0.0 /100 | #276 | Tragic 83.2% |
| Samoans | 0.0 /100 | #277 | Tragic 83.2% |
| Belizeans | 0.0 /100 | #278 | Tragic 83.1% |
| Immigrants | Micronesia | 0.0 /100 | #279 | Tragic 83.1% |
| Dominicans | 0.0 /100 | #280 | Tragic 83.1% |
| Guatemalans | 0.0 /100 | #281 | Tragic 83.0% |
| Osage | 0.0 /100 | #282 | Tragic 82.9% |
| Immigrants | Guatemala | 0.0 /100 | #283 | Tragic 82.9% |
| Immigrants | Dominican Republic | 0.0 /100 | #284 | Tragic 82.9% |
| Fijians | 0.0 /100 | #285 | Tragic 82.9% |
| Immigrants | Bangladesh | 0.0 /100 | #286 | Tragic 82.9% |
| Immigrants | Belize | 0.0 /100 | #287 | Tragic 82.9% |