Immigrants from Greece vs Jordanian In Labor Force | Age 45-54
COMPARE
Immigrants from Greece
Jordanian
In Labor Force | Age 45-54
In Labor Force | Age 45-54 Comparison
Immigrants from Greece
Jordanians
83.6%
IN LABOR FORCE | AGE 45-54
98.8/ 100
METRIC RATING
50th/ 347
METRIC RANK
83.4%
IN LABOR FORCE | AGE 45-54
96.4/ 100
METRIC RATING
81st/ 347
METRIC RANK
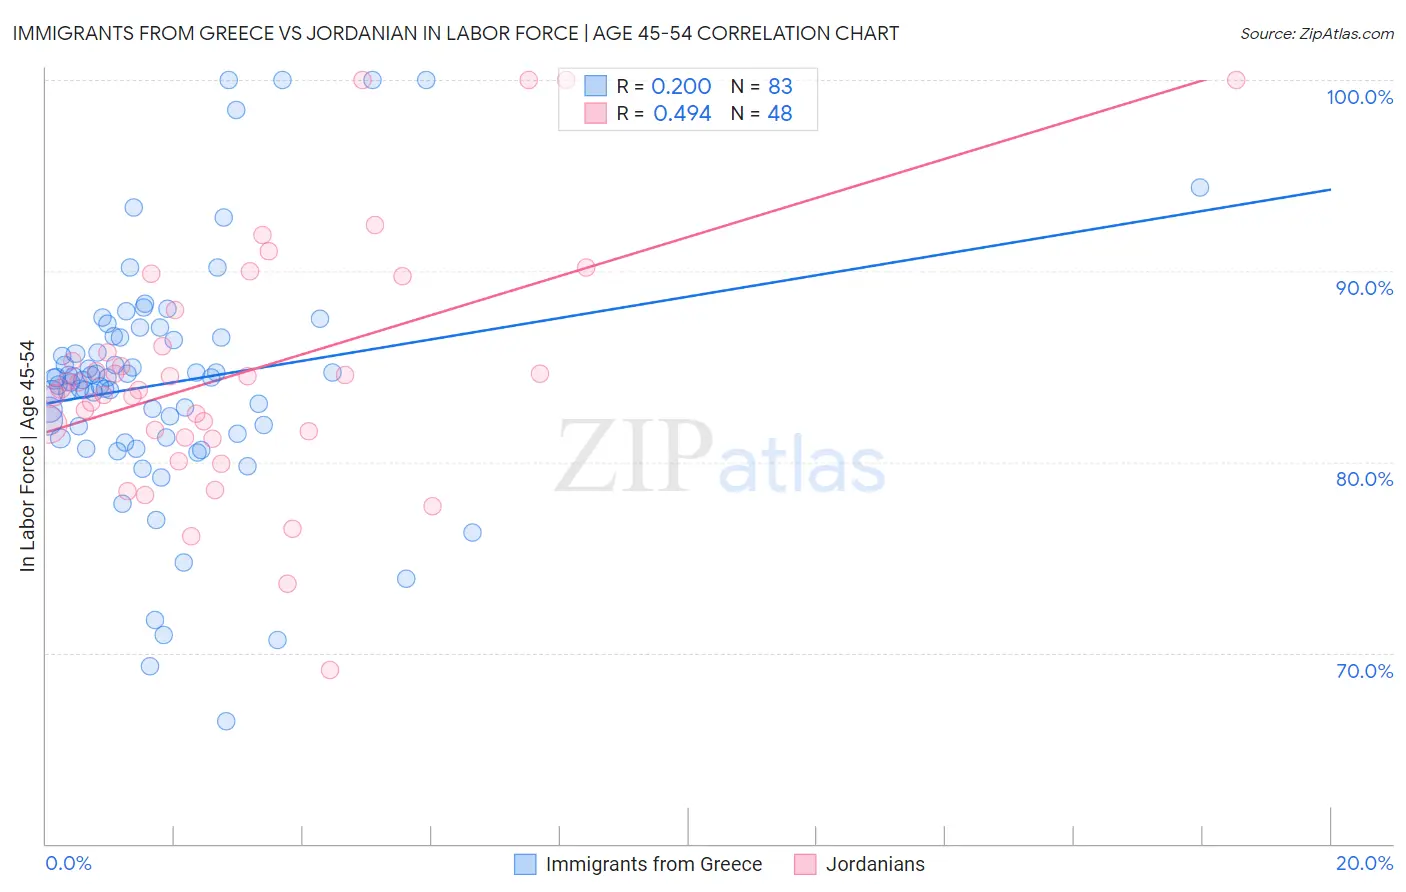
Immigrants from Greece vs Jordanian In Labor Force | Age 45-54 Correlation Chart
The statistical analysis conducted on geographies consisting of 216,863,996 people shows a weak positive correlation between the proportion of Immigrants from Greece and labor force participation rate among population between the ages 45 and 54 in the United States with a correlation coefficient (R) of 0.200 and weighted average of 83.6%. Similarly, the statistical analysis conducted on geographies consisting of 166,384,997 people shows a moderate positive correlation between the proportion of Jordanians and labor force participation rate among population between the ages 45 and 54 in the United States with a correlation coefficient (R) of 0.494 and weighted average of 83.4%, a difference of 0.24%.
In Labor Force | Age 45-54 Correlation Summary
| Measurement | Immigrants from Greece | Jordanian |
| Minimum | 66.4% | 69.1% |
| Maximum | 100.0% | 100.0% |
| Range | 33.6% | 30.9% |
| Mean | 84.1% | 84.7% |
| Median | 84.3% | 84.0% |
| Interquartile 25% (IQ1) | 81.3% | 81.5% |
| Interquartile 75% (IQ3) | 86.5% | 87.0% |
| Interquartile Range (IQR) | 5.2% | 5.6% |
| Standard Deviation (Sample) | 6.3% | 6.5% |
| Standard Deviation (Population) | 6.3% | 6.5% |
Similar Demographics by In Labor Force | Age 45-54
Demographics Similar to Immigrants from Greece by In Labor Force | Age 45-54
In terms of in labor force | age 45-54, the demographic groups most similar to Immigrants from Greece are Immigrants from Turkey (83.6%, a difference of 0.010%), Polish (83.6%, a difference of 0.010%), Peruvian (83.6%, a difference of 0.010%), Somali (83.5%, a difference of 0.020%), and Macedonian (83.5%, a difference of 0.020%).
| Demographics | Rating | Rank | In Labor Force | Age 45-54 |
| Venezuelans | 99.2 /100 | #43 | Exceptional 83.6% |
| Burmese | 99.1 /100 | #44 | Exceptional 83.6% |
| Immigrants | Hong Kong | 99.1 /100 | #45 | Exceptional 83.6% |
| Lithuanians | 99.1 /100 | #46 | Exceptional 83.6% |
| Croatians | 99.0 /100 | #47 | Exceptional 83.6% |
| Immigrants | Poland | 99.0 /100 | #48 | Exceptional 83.6% |
| Immigrants | Morocco | 99.0 /100 | #49 | Exceptional 83.6% |
| Immigrants | Greece | 98.8 /100 | #50 | Exceptional 83.6% |
| Immigrants | Turkey | 98.8 /100 | #51 | Exceptional 83.6% |
| Poles | 98.7 /100 | #52 | Exceptional 83.6% |
| Peruvians | 98.7 /100 | #53 | Exceptional 83.6% |
| Somalis | 98.7 /100 | #54 | Exceptional 83.5% |
| Macedonians | 98.7 /100 | #55 | Exceptional 83.5% |
| Immigrants | Peru | 98.6 /100 | #56 | Exceptional 83.5% |
| Paraguayans | 98.5 /100 | #57 | Exceptional 83.5% |
Demographics Similar to Jordanians by In Labor Force | Age 45-54
In terms of in labor force | age 45-54, the demographic groups most similar to Jordanians are Immigrants from Croatia (83.4%, a difference of 0.0%), Immigrants from Egypt (83.4%, a difference of 0.010%), Belgian (83.4%, a difference of 0.010%), Immigrants from Eastern Asia (83.4%, a difference of 0.010%), and Immigrants from Zimbabwe (83.4%, a difference of 0.010%).
| Demographics | Rating | Rank | In Labor Force | Age 45-54 |
| Immigrants | Somalia | 96.9 /100 | #74 | Exceptional 83.4% |
| Estonians | 96.9 /100 | #75 | Exceptional 83.4% |
| Russians | 96.8 /100 | #76 | Exceptional 83.4% |
| Cubans | 96.7 /100 | #77 | Exceptional 83.4% |
| Immigrants | Egypt | 96.6 /100 | #78 | Exceptional 83.4% |
| Belgians | 96.5 /100 | #79 | Exceptional 83.4% |
| Immigrants | Croatia | 96.5 /100 | #80 | Exceptional 83.4% |
| Jordanians | 96.4 /100 | #81 | Exceptional 83.4% |
| Immigrants | Eastern Asia | 96.3 /100 | #82 | Exceptional 83.4% |
| Immigrants | Zimbabwe | 96.3 /100 | #83 | Exceptional 83.4% |
| Immigrants | Bosnia and Herzegovina | 96.0 /100 | #84 | Exceptional 83.3% |
| Greeks | 95.9 /100 | #85 | Exceptional 83.3% |
| Immigrants | Northern Africa | 95.7 /100 | #86 | Exceptional 83.3% |
| Immigrants | Eastern Europe | 95.6 /100 | #87 | Exceptional 83.3% |
| Immigrants | Asia | 95.6 /100 | #88 | Exceptional 83.3% |