U.S. Virgin Islander vs Immigrants from Fiji In Labor Force | Age 45-54
COMPARE
U.S. Virgin Islander
Immigrants from Fiji
In Labor Force | Age 45-54
In Labor Force | Age 45-54 Comparison
U.S. Virgin Islanders
Immigrants from Fiji
81.2%
IN LABOR FORCE | AGE 45-54
0.0/ 100
METRIC RATING
276th/ 347
METRIC RANK
81.5%
IN LABOR FORCE | AGE 45-54
0.1/ 100
METRIC RATING
258th/ 347
METRIC RANK
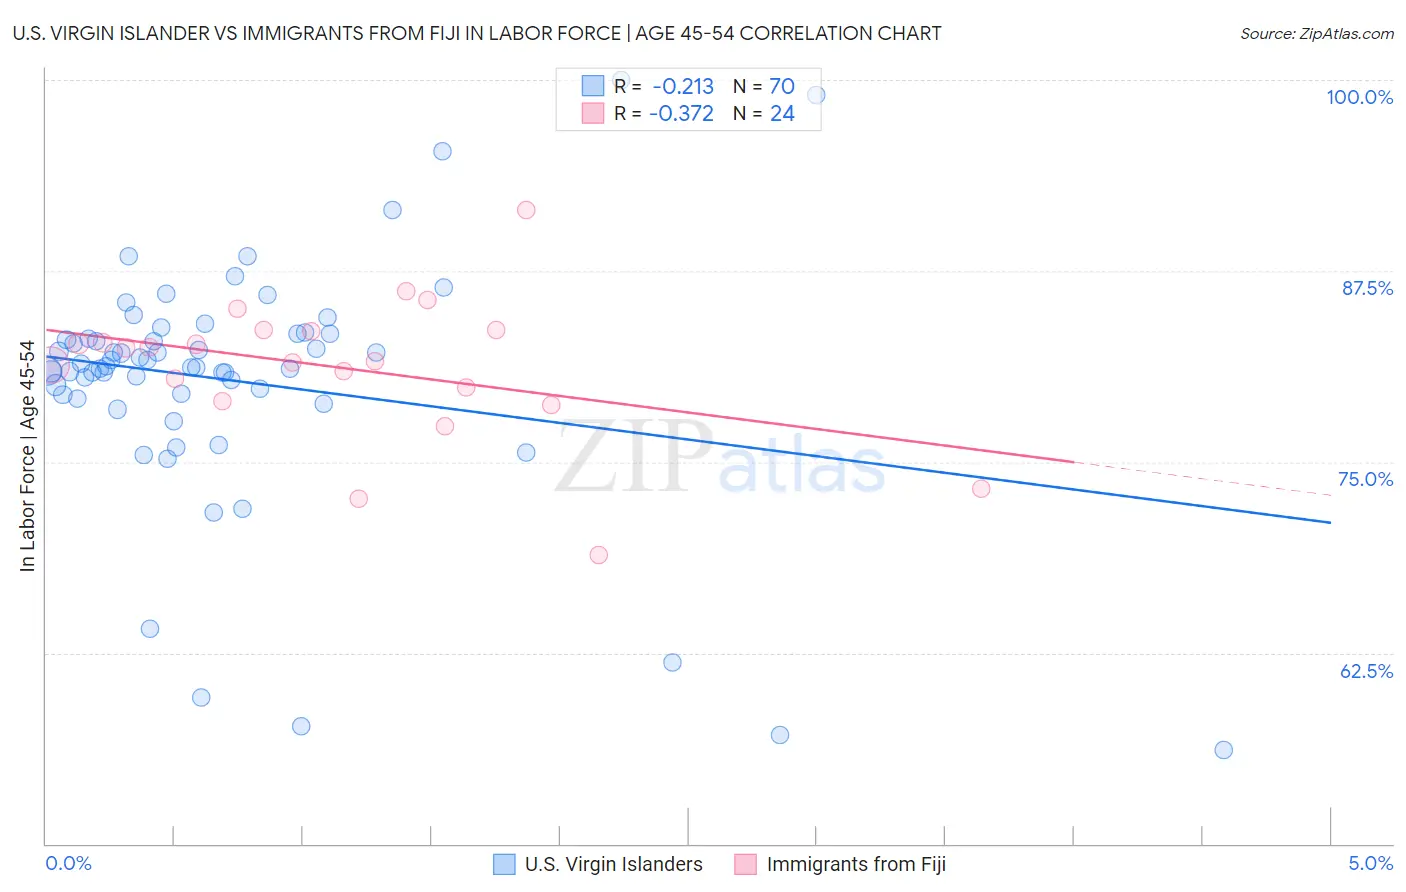
U.S. Virgin Islander vs Immigrants from Fiji In Labor Force | Age 45-54 Correlation Chart
The statistical analysis conducted on geographies consisting of 87,510,116 people shows a weak negative correlation between the proportion of U.S. Virgin Islanders and labor force participation rate among population between the ages 45 and 54 in the United States with a correlation coefficient (R) of -0.213 and weighted average of 81.2%. Similarly, the statistical analysis conducted on geographies consisting of 93,754,712 people shows a mild negative correlation between the proportion of Immigrants from Fiji and labor force participation rate among population between the ages 45 and 54 in the United States with a correlation coefficient (R) of -0.372 and weighted average of 81.5%, a difference of 0.43%.
In Labor Force | Age 45-54 Correlation Summary
| Measurement | U.S. Virgin Islander | Immigrants from Fiji |
| Minimum | 56.1% | 68.9% |
| Maximum | 100.0% | 91.5% |
| Range | 43.9% | 22.6% |
| Mean | 80.3% | 81.2% |
| Median | 81.2% | 82.0% |
| Interquartile 25% (IQ1) | 79.4% | 79.5% |
| Interquartile 75% (IQ3) | 83.4% | 83.6% |
| Interquartile Range (IQR) | 4.0% | 4.1% |
| Standard Deviation (Sample) | 8.1% | 4.7% |
| Standard Deviation (Population) | 8.0% | 4.6% |
Demographics Similar to U.S. Virgin Islanders and Immigrants from Fiji by In Labor Force | Age 45-54
In terms of in labor force | age 45-54, the demographic groups most similar to U.S. Virgin Islanders are Guatemalan (81.2%, a difference of 0.020%), Nonimmigrants (81.2%, a difference of 0.040%), British West Indian (81.2%, a difference of 0.050%), Chippewa (81.3%, a difference of 0.090%), and Immigrants from Barbados (81.3%, a difference of 0.15%). Similarly, the demographic groups most similar to Immigrants from Fiji are Immigrants from Congo (81.6%, a difference of 0.010%), Guyanese (81.5%, a difference of 0.010%), Spaniard (81.5%, a difference of 0.030%), Hawaiian (81.5%, a difference of 0.050%), and Immigrants from Guyana (81.5%, a difference of 0.050%).
| Demographics | Rating | Rank | In Labor Force | Age 45-54 |
| Immigrants | Congo | 0.1 /100 | #257 | Tragic 81.6% |
| Immigrants | Fiji | 0.1 /100 | #258 | Tragic 81.5% |
| Guyanese | 0.1 /100 | #259 | Tragic 81.5% |
| Spaniards | 0.1 /100 | #260 | Tragic 81.5% |
| Hawaiians | 0.1 /100 | #261 | Tragic 81.5% |
| Immigrants | Guyana | 0.1 /100 | #262 | Tragic 81.5% |
| Indonesians | 0.1 /100 | #263 | Tragic 81.5% |
| Immigrants | West Indies | 0.1 /100 | #264 | Tragic 81.5% |
| Hondurans | 0.1 /100 | #265 | Tragic 81.4% |
| Immigrants | St. Vincent and the Grenadines | 0.1 /100 | #266 | Tragic 81.4% |
| West Indians | 0.1 /100 | #267 | Tragic 81.4% |
| Immigrants | Honduras | 0.0 /100 | #268 | Tragic 81.4% |
| Alsatians | 0.0 /100 | #269 | Tragic 81.3% |
| Bangladeshis | 0.0 /100 | #270 | Tragic 81.3% |
| Immigrants | Barbados | 0.0 /100 | #271 | Tragic 81.3% |
| Spanish | 0.0 /100 | #272 | Tragic 81.3% |
| Chippewa | 0.0 /100 | #273 | Tragic 81.3% |
| British West Indians | 0.0 /100 | #274 | Tragic 81.2% |
| Immigrants | Nonimmigrants | 0.0 /100 | #275 | Tragic 81.2% |
| U.S. Virgin Islanders | 0.0 /100 | #276 | Tragic 81.2% |
| Guatemalans | 0.0 /100 | #277 | Tragic 81.2% |