Immigrants from Pakistan vs Jordanian In Labor Force | Age 45-54
COMPARE
Immigrants from Pakistan
Jordanian
In Labor Force | Age 45-54
In Labor Force | Age 45-54 Comparison
Immigrants from Pakistan
Jordanians
83.8%
IN LABOR FORCE | AGE 45-54
99.7/ 100
METRIC RATING
29th/ 347
METRIC RANK
83.4%
IN LABOR FORCE | AGE 45-54
96.4/ 100
METRIC RATING
81st/ 347
METRIC RANK
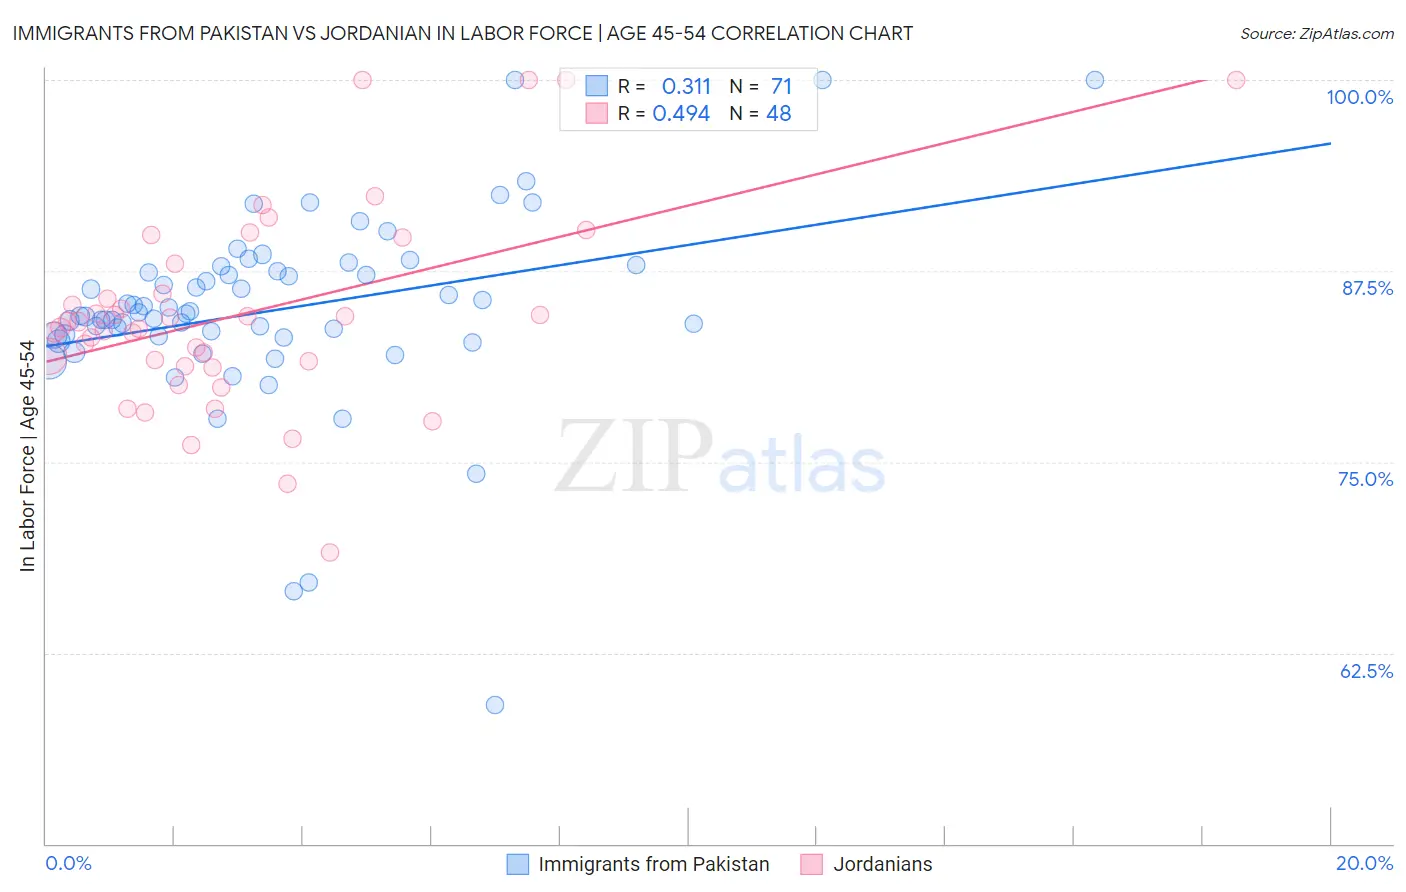
Immigrants from Pakistan vs Jordanian In Labor Force | Age 45-54 Correlation Chart
The statistical analysis conducted on geographies consisting of 283,776,614 people shows a mild positive correlation between the proportion of Immigrants from Pakistan and labor force participation rate among population between the ages 45 and 54 in the United States with a correlation coefficient (R) of 0.311 and weighted average of 83.8%. Similarly, the statistical analysis conducted on geographies consisting of 166,384,997 people shows a moderate positive correlation between the proportion of Jordanians and labor force participation rate among population between the ages 45 and 54 in the United States with a correlation coefficient (R) of 0.494 and weighted average of 83.4%, a difference of 0.58%.
In Labor Force | Age 45-54 Correlation Summary
| Measurement | Immigrants from Pakistan | Jordanian |
| Minimum | 59.1% | 69.1% |
| Maximum | 100.0% | 100.0% |
| Range | 40.9% | 30.9% |
| Mean | 84.9% | 84.7% |
| Median | 84.7% | 84.0% |
| Interquartile 25% (IQ1) | 83.2% | 81.5% |
| Interquartile 75% (IQ3) | 87.5% | 87.0% |
| Interquartile Range (IQR) | 4.3% | 5.6% |
| Standard Deviation (Sample) | 6.3% | 6.5% |
| Standard Deviation (Population) | 6.3% | 6.5% |
Similar Demographics by In Labor Force | Age 45-54
Demographics Similar to Immigrants from Pakistan by In Labor Force | Age 45-54
In terms of in labor force | age 45-54, the demographic groups most similar to Immigrants from Pakistan are Immigrants from Lithuania (83.9%, a difference of 0.020%), Immigrants from Brazil (83.9%, a difference of 0.030%), Immigrants from Bulgaria (83.8%, a difference of 0.030%), Immigrants from Serbia (83.9%, a difference of 0.040%), and Immigrants from North Macedonia (83.9%, a difference of 0.050%).
| Demographics | Rating | Rank | In Labor Force | Age 45-54 |
| Immigrants | Ireland | 99.8 /100 | #22 | Exceptional 83.9% |
| Tlingit-Haida | 99.8 /100 | #23 | Exceptional 83.9% |
| Slovenes | 99.8 /100 | #24 | Exceptional 83.9% |
| Immigrants | North Macedonia | 99.8 /100 | #25 | Exceptional 83.9% |
| Immigrants | Serbia | 99.8 /100 | #26 | Exceptional 83.9% |
| Immigrants | Brazil | 99.8 /100 | #27 | Exceptional 83.9% |
| Immigrants | Lithuania | 99.8 /100 | #28 | Exceptional 83.9% |
| Immigrants | Pakistan | 99.7 /100 | #29 | Exceptional 83.8% |
| Immigrants | Bulgaria | 99.7 /100 | #30 | Exceptional 83.8% |
| Immigrants | Eritrea | 99.7 /100 | #31 | Exceptional 83.8% |
| Turks | 99.7 /100 | #32 | Exceptional 83.8% |
| Latvians | 99.7 /100 | #33 | Exceptional 83.8% |
| Kenyans | 99.5 /100 | #34 | Exceptional 83.7% |
| Brazilians | 99.5 /100 | #35 | Exceptional 83.7% |
| Ugandans | 99.5 /100 | #36 | Exceptional 83.7% |
Demographics Similar to Jordanians by In Labor Force | Age 45-54
In terms of in labor force | age 45-54, the demographic groups most similar to Jordanians are Immigrants from Croatia (83.4%, a difference of 0.0%), Immigrants from Egypt (83.4%, a difference of 0.010%), Belgian (83.4%, a difference of 0.010%), Immigrants from Eastern Asia (83.4%, a difference of 0.010%), and Immigrants from Zimbabwe (83.4%, a difference of 0.010%).
| Demographics | Rating | Rank | In Labor Force | Age 45-54 |
| Immigrants | Somalia | 96.9 /100 | #74 | Exceptional 83.4% |
| Estonians | 96.9 /100 | #75 | Exceptional 83.4% |
| Russians | 96.8 /100 | #76 | Exceptional 83.4% |
| Cubans | 96.7 /100 | #77 | Exceptional 83.4% |
| Immigrants | Egypt | 96.6 /100 | #78 | Exceptional 83.4% |
| Belgians | 96.5 /100 | #79 | Exceptional 83.4% |
| Immigrants | Croatia | 96.5 /100 | #80 | Exceptional 83.4% |
| Jordanians | 96.4 /100 | #81 | Exceptional 83.4% |
| Immigrants | Eastern Asia | 96.3 /100 | #82 | Exceptional 83.4% |
| Immigrants | Zimbabwe | 96.3 /100 | #83 | Exceptional 83.4% |
| Immigrants | Bosnia and Herzegovina | 96.0 /100 | #84 | Exceptional 83.3% |
| Greeks | 95.9 /100 | #85 | Exceptional 83.3% |
| Immigrants | Northern Africa | 95.7 /100 | #86 | Exceptional 83.3% |
| Immigrants | Eastern Europe | 95.6 /100 | #87 | Exceptional 83.3% |
| Immigrants | Asia | 95.6 /100 | #88 | Exceptional 83.3% |