Immigrants from Dominica vs Immigrants from Caribbean In Labor Force | Age 16-19
COMPARE
Immigrants from Dominica
Immigrants from Caribbean
In Labor Force | Age 16-19
In Labor Force | Age 16-19 Comparison
Immigrants from Dominica
Immigrants from Caribbean
32.5%
IN LABOR FORCE | AGE 16-19
0.0/ 100
METRIC RATING
303rd/ 347
METRIC RANK
31.2%
IN LABOR FORCE | AGE 16-19
0.0/ 100
METRIC RATING
323rd/ 347
METRIC RANK
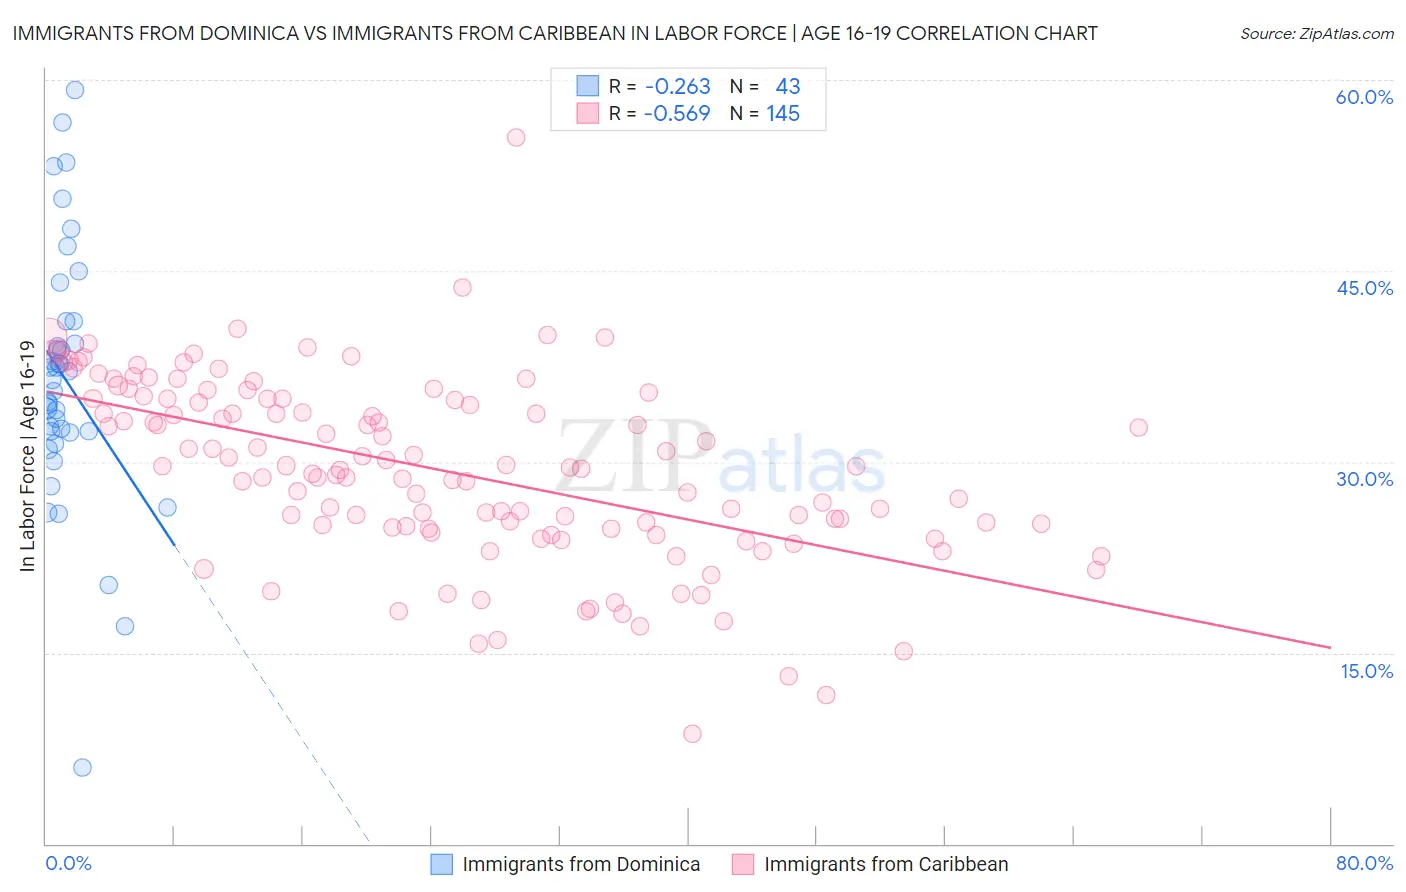
Immigrants from Dominica vs Immigrants from Caribbean In Labor Force | Age 16-19 Correlation Chart
The statistical analysis conducted on geographies consisting of 83,778,469 people shows a weak negative correlation between the proportion of Immigrants from Dominica and labor force participation rate among population between the ages 16 and 19 in the United States with a correlation coefficient (R) of -0.263 and weighted average of 32.5%. Similarly, the statistical analysis conducted on geographies consisting of 448,967,505 people shows a substantial negative correlation between the proportion of Immigrants from Caribbean and labor force participation rate among population between the ages 16 and 19 in the United States with a correlation coefficient (R) of -0.569 and weighted average of 31.2%, a difference of 3.9%.
In Labor Force | Age 16-19 Correlation Summary
| Measurement | Immigrants from Dominica | Immigrants from Caribbean |
| Minimum | 6.0% | 8.6% |
| Maximum | 59.2% | 55.5% |
| Range | 53.2% | 46.9% |
| Mean | 36.5% | 29.4% |
| Median | 36.5% | 29.6% |
| Interquartile 25% (IQ1) | 32.3% | 24.8% |
| Interquartile 75% (IQ3) | 41.0% | 35.0% |
| Interquartile Range (IQR) | 8.7% | 10.1% |
| Standard Deviation (Sample) | 10.1% | 7.2% |
| Standard Deviation (Population) | 10.0% | 7.2% |
Demographics Similar to Immigrants from Dominica and Immigrants from Caribbean by In Labor Force | Age 16-19
In terms of in labor force | age 16-19, the demographic groups most similar to Immigrants from Dominica are Israeli (32.4%, a difference of 0.19%), Nicaraguan (32.4%, a difference of 0.24%), Spanish American Indian (32.4%, a difference of 0.37%), Immigrants from Jamaica (32.2%, a difference of 0.86%), and Navajo (32.1%, a difference of 1.2%). Similarly, the demographic groups most similar to Immigrants from Caribbean are Tohono O'odham (31.3%, a difference of 0.13%), West Indian (31.3%, a difference of 0.25%), Ecuadorian (31.4%, a difference of 0.48%), Soviet Union (31.4%, a difference of 0.54%), and Immigrants from Yemen (31.5%, a difference of 0.87%).
| Demographics | Rating | Rank | In Labor Force | Age 16-19 |
| Immigrants | Dominica | 0.0 /100 | #303 | Tragic 32.5% |
| Israelis | 0.0 /100 | #304 | Tragic 32.4% |
| Nicaraguans | 0.0 /100 | #305 | Tragic 32.4% |
| Spanish American Indians | 0.0 /100 | #306 | Tragic 32.4% |
| Immigrants | Jamaica | 0.0 /100 | #307 | Tragic 32.2% |
| Navajo | 0.0 /100 | #308 | Tragic 32.1% |
| Immigrants | Eastern Asia | 0.0 /100 | #309 | Tragic 32.0% |
| Immigrants | Iran | 0.0 /100 | #310 | Tragic 32.0% |
| Indians (Asian) | 0.0 /100 | #311 | Tragic 31.9% |
| Immigrants | Belize | 0.0 /100 | #312 | Tragic 31.8% |
| Hopi | 0.0 /100 | #313 | Tragic 31.8% |
| Cubans | 0.0 /100 | #314 | Tragic 31.8% |
| Immigrants | West Indies | 0.0 /100 | #315 | Tragic 31.7% |
| Filipinos | 0.0 /100 | #316 | Tragic 31.7% |
| Immigrants | Nicaragua | 0.0 /100 | #317 | Tragic 31.6% |
| Immigrants | Yemen | 0.0 /100 | #318 | Tragic 31.5% |
| Soviet Union | 0.0 /100 | #319 | Tragic 31.4% |
| Ecuadorians | 0.0 /100 | #320 | Tragic 31.4% |
| West Indians | 0.0 /100 | #321 | Tragic 31.3% |
| Tohono O'odham | 0.0 /100 | #322 | Tragic 31.3% |
| Immigrants | Caribbean | 0.0 /100 | #323 | Tragic 31.2% |