Immigrants from North Macedonia vs Immigrants from Caribbean In Labor Force | Age 16-19
COMPARE
Immigrants from North Macedonia
Immigrants from Caribbean
In Labor Force | Age 16-19
In Labor Force | Age 16-19 Comparison
Immigrants from North Macedonia
Immigrants from Caribbean
38.9%
IN LABOR FORCE | AGE 16-19
99.3/ 100
METRIC RATING
99th/ 347
METRIC RANK
31.2%
IN LABOR FORCE | AGE 16-19
0.0/ 100
METRIC RATING
323rd/ 347
METRIC RANK
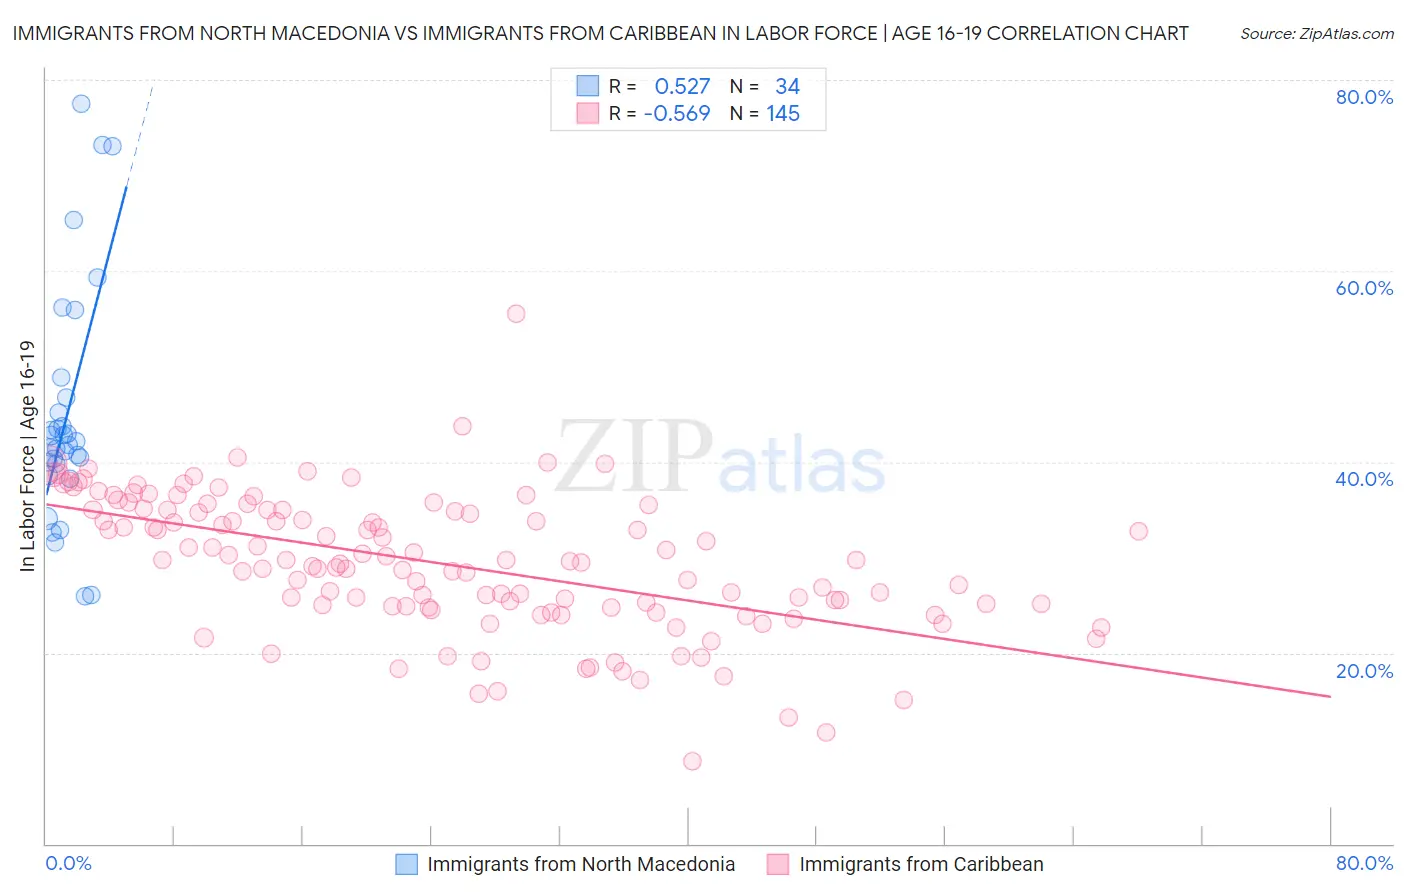
Immigrants from North Macedonia vs Immigrants from Caribbean In Labor Force | Age 16-19 Correlation Chart
The statistical analysis conducted on geographies consisting of 74,262,337 people shows a substantial positive correlation between the proportion of Immigrants from North Macedonia and labor force participation rate among population between the ages 16 and 19 in the United States with a correlation coefficient (R) of 0.527 and weighted average of 38.9%. Similarly, the statistical analysis conducted on geographies consisting of 448,967,505 people shows a substantial negative correlation between the proportion of Immigrants from Caribbean and labor force participation rate among population between the ages 16 and 19 in the United States with a correlation coefficient (R) of -0.569 and weighted average of 31.2%, a difference of 24.4%.
In Labor Force | Age 16-19 Correlation Summary
| Measurement | Immigrants from North Macedonia | Immigrants from Caribbean |
| Minimum | 25.9% | 8.6% |
| Maximum | 77.6% | 55.5% |
| Range | 51.7% | 46.9% |
| Mean | 45.0% | 29.4% |
| Median | 42.0% | 29.6% |
| Interquartile 25% (IQ1) | 39.8% | 24.8% |
| Interquartile 75% (IQ3) | 46.7% | 35.0% |
| Interquartile Range (IQR) | 7.0% | 10.1% |
| Standard Deviation (Sample) | 12.5% | 7.2% |
| Standard Deviation (Population) | 12.3% | 7.2% |
Similar Demographics by In Labor Force | Age 16-19
Demographics Similar to Immigrants from North Macedonia by In Labor Force | Age 16-19
In terms of in labor force | age 16-19, the demographic groups most similar to Immigrants from North Macedonia are Ugandan (38.9%, a difference of 0.020%), Greek (38.9%, a difference of 0.030%), Latvian (38.9%, a difference of 0.070%), Immigrants from North America (38.9%, a difference of 0.10%), and Blackfeet (38.9%, a difference of 0.19%).
| Demographics | Rating | Rank | In Labor Force | Age 16-19 |
| Osage | 99.4 /100 | #92 | Exceptional 39.0% |
| Blackfeet | 99.4 /100 | #93 | Exceptional 38.9% |
| Immigrants | Canada | 99.4 /100 | #94 | Exceptional 38.9% |
| Immigrants | North America | 99.4 /100 | #95 | Exceptional 38.9% |
| Latvians | 99.4 /100 | #96 | Exceptional 38.9% |
| Greeks | 99.3 /100 | #97 | Exceptional 38.9% |
| Ugandans | 99.3 /100 | #98 | Exceptional 38.9% |
| Immigrants | North Macedonia | 99.3 /100 | #99 | Exceptional 38.9% |
| Immigrants | Thailand | 99.1 /100 | #100 | Exceptional 38.7% |
| Hmong | 99.1 /100 | #101 | Exceptional 38.7% |
| Zimbabweans | 99.1 /100 | #102 | Exceptional 38.7% |
| Immigrants | Cameroon | 99.0 /100 | #103 | Exceptional 38.7% |
| Immigrants | Eritrea | 99.0 /100 | #104 | Exceptional 38.7% |
| Iraqis | 98.9 /100 | #105 | Exceptional 38.6% |
| Delaware | 98.8 /100 | #106 | Exceptional 38.6% |
Demographics Similar to Immigrants from Caribbean by In Labor Force | Age 16-19
In terms of in labor force | age 16-19, the demographic groups most similar to Immigrants from Caribbean are Tohono O'odham (31.3%, a difference of 0.13%), Dominican (31.2%, a difference of 0.18%), West Indian (31.3%, a difference of 0.25%), Immigrants from China (31.1%, a difference of 0.33%), and Ecuadorian (31.4%, a difference of 0.48%).
| Demographics | Rating | Rank | In Labor Force | Age 16-19 |
| Filipinos | 0.0 /100 | #316 | Tragic 31.7% |
| Immigrants | Nicaragua | 0.0 /100 | #317 | Tragic 31.6% |
| Immigrants | Yemen | 0.0 /100 | #318 | Tragic 31.5% |
| Soviet Union | 0.0 /100 | #319 | Tragic 31.4% |
| Ecuadorians | 0.0 /100 | #320 | Tragic 31.4% |
| West Indians | 0.0 /100 | #321 | Tragic 31.3% |
| Tohono O'odham | 0.0 /100 | #322 | Tragic 31.3% |
| Immigrants | Caribbean | 0.0 /100 | #323 | Tragic 31.2% |
| Dominicans | 0.0 /100 | #324 | Tragic 31.2% |
| Immigrants | China | 0.0 /100 | #325 | Tragic 31.1% |
| Immigrants | Dominican Republic | 0.0 /100 | #326 | Tragic 31.1% |
| Immigrants | Taiwan | 0.0 /100 | #327 | Tragic 31.0% |
| Immigrants | Ecuador | 0.0 /100 | #328 | Tragic 31.0% |
| Barbadians | 0.0 /100 | #329 | Tragic 31.0% |
| Lumbee | 0.0 /100 | #330 | Tragic 31.0% |