Ukrainian vs Immigrants from Guyana Hearing Disability
COMPARE
Ukrainian
Immigrants from Guyana
Hearing Disability
Hearing Disability Comparison
Ukrainians
Immigrants from Guyana
3.2%
HEARING DISABILITY
2.9/ 100
METRIC RATING
232nd/ 347
METRIC RANK
2.3%
HEARING DISABILITY
100.0/ 100
METRIC RATING
4th/ 347
METRIC RANK
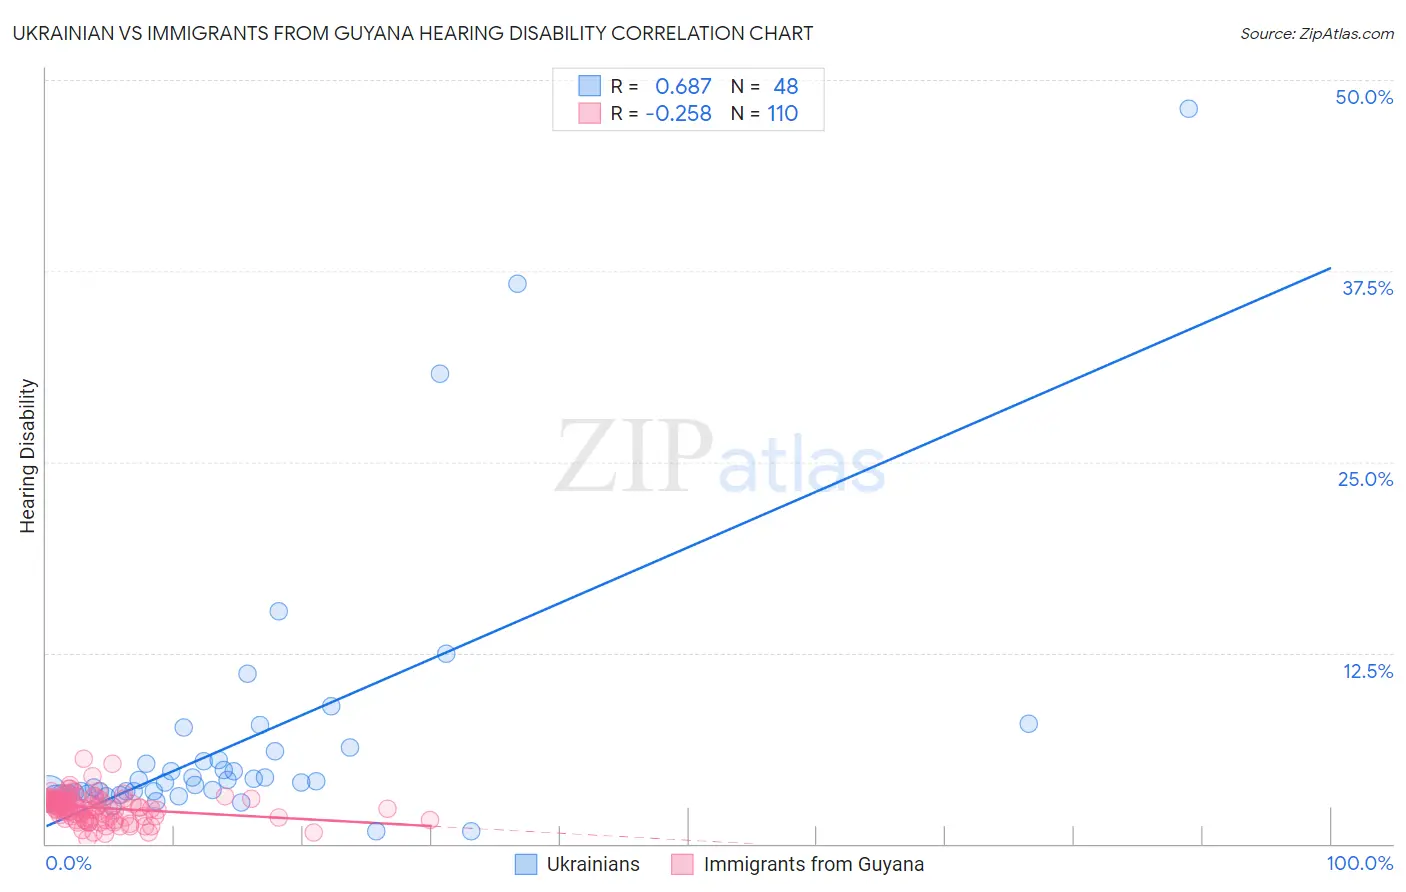
Ukrainian vs Immigrants from Guyana Hearing Disability Correlation Chart
The statistical analysis conducted on geographies consisting of 448,464,085 people shows a significant positive correlation between the proportion of Ukrainians and percentage of population with hearing disability in the United States with a correlation coefficient (R) of 0.687 and weighted average of 3.2%. Similarly, the statistical analysis conducted on geographies consisting of 183,657,050 people shows a weak negative correlation between the proportion of Immigrants from Guyana and percentage of population with hearing disability in the United States with a correlation coefficient (R) of -0.258 and weighted average of 2.3%, a difference of 39.9%.
Hearing Disability Correlation Summary
| Measurement | Ukrainian | Immigrants from Guyana |
| Minimum | 0.79% | 0.33% |
| Maximum | 48.1% | 5.6% |
| Range | 47.4% | 5.2% |
| Mean | 6.9% | 2.4% |
| Median | 4.1% | 2.4% |
| Interquartile 25% (IQ1) | 3.3% | 1.8% |
| Interquartile 75% (IQ3) | 5.8% | 2.9% |
| Interquartile Range (IQR) | 2.5% | 1.1% |
| Standard Deviation (Sample) | 8.9% | 0.87% |
| Standard Deviation (Population) | 8.8% | 0.86% |
Similar Demographics by Hearing Disability
Demographics Similar to Ukrainians by Hearing Disability
In terms of hearing disability, the demographic groups most similar to Ukrainians are Luxembourger (3.2%, a difference of 0.050%), Greek (3.2%, a difference of 0.28%), Estonian (3.3%, a difference of 0.37%), Central American Indian (3.3%, a difference of 0.44%), and Guamanian/Chamorro (3.3%, a difference of 0.55%).
| Demographics | Rating | Rank | Hearing Disability |
| Latvians | 5.1 /100 | #225 | Tragic 3.2% |
| Lebanese | 5.0 /100 | #226 | Tragic 3.2% |
| Bhutanese | 4.6 /100 | #227 | Tragic 3.2% |
| Immigrants | Portugal | 4.3 /100 | #228 | Tragic 3.2% |
| Maltese | 4.1 /100 | #229 | Tragic 3.2% |
| Greeks | 3.2 /100 | #230 | Tragic 3.2% |
| Luxembourgers | 2.9 /100 | #231 | Tragic 3.2% |
| Ukrainians | 2.9 /100 | #232 | Tragic 3.2% |
| Estonians | 2.4 /100 | #233 | Tragic 3.3% |
| Central American Indians | 2.3 /100 | #234 | Tragic 3.3% |
| Guamanians/Chamorros | 2.2 /100 | #235 | Tragic 3.3% |
| Serbians | 2.2 /100 | #236 | Tragic 3.3% |
| Immigrants | Austria | 1.8 /100 | #237 | Tragic 3.3% |
| German Russians | 1.8 /100 | #238 | Tragic 3.3% |
| Nepalese | 1.2 /100 | #239 | Tragic 3.3% |
Demographics Similar to Immigrants from Guyana by Hearing Disability
In terms of hearing disability, the demographic groups most similar to Immigrants from Guyana are Guyanese (2.3%, a difference of 1.4%), Immigrants from Barbados (2.4%, a difference of 1.9%), Immigrants from St. Vincent and the Grenadines (2.3%, a difference of 2.8%), Vietnamese (2.4%, a difference of 3.0%), and Immigrants from Bangladesh (2.4%, a difference of 4.6%).
| Demographics | Rating | Rank | Hearing Disability |
| Immigrants | Grenada | 100.0 /100 | #1 | Exceptional 2.2% |
| Immigrants | St. Vincent and the Grenadines | 100.0 /100 | #2 | Exceptional 2.3% |
| Guyanese | 100.0 /100 | #3 | Exceptional 2.3% |
| Immigrants | Guyana | 100.0 /100 | #4 | Exceptional 2.3% |
| Immigrants | Barbados | 100.0 /100 | #5 | Exceptional 2.4% |
| Vietnamese | 100.0 /100 | #6 | Exceptional 2.4% |
| Immigrants | Bangladesh | 100.0 /100 | #7 | Exceptional 2.4% |
| British West Indians | 100.0 /100 | #8 | Exceptional 2.4% |
| Immigrants | Dominican Republic | 100.0 /100 | #9 | Exceptional 2.4% |
| Immigrants | Ecuador | 99.9 /100 | #10 | Exceptional 2.5% |
| Immigrants | Trinidad and Tobago | 99.9 /100 | #11 | Exceptional 2.5% |
| Trinidadians and Tobagonians | 99.9 /100 | #12 | Exceptional 2.5% |
| Sierra Leoneans | 99.9 /100 | #13 | Exceptional 2.5% |
| Ecuadorians | 99.9 /100 | #14 | Exceptional 2.5% |
| Barbadians | 99.9 /100 | #15 | Exceptional 2.5% |