Bolivian vs Finnish In Labor Force | Age 16-19
COMPARE
Bolivian
Finnish
In Labor Force | Age 16-19
In Labor Force | Age 16-19 Comparison
Bolivians
Finns
36.0%
IN LABOR FORCE | AGE 16-19
23.3/ 100
METRIC RATING
195th/ 347
METRIC RANK
43.9%
IN LABOR FORCE | AGE 16-19
100.0/ 100
METRIC RATING
12th/ 347
METRIC RANK
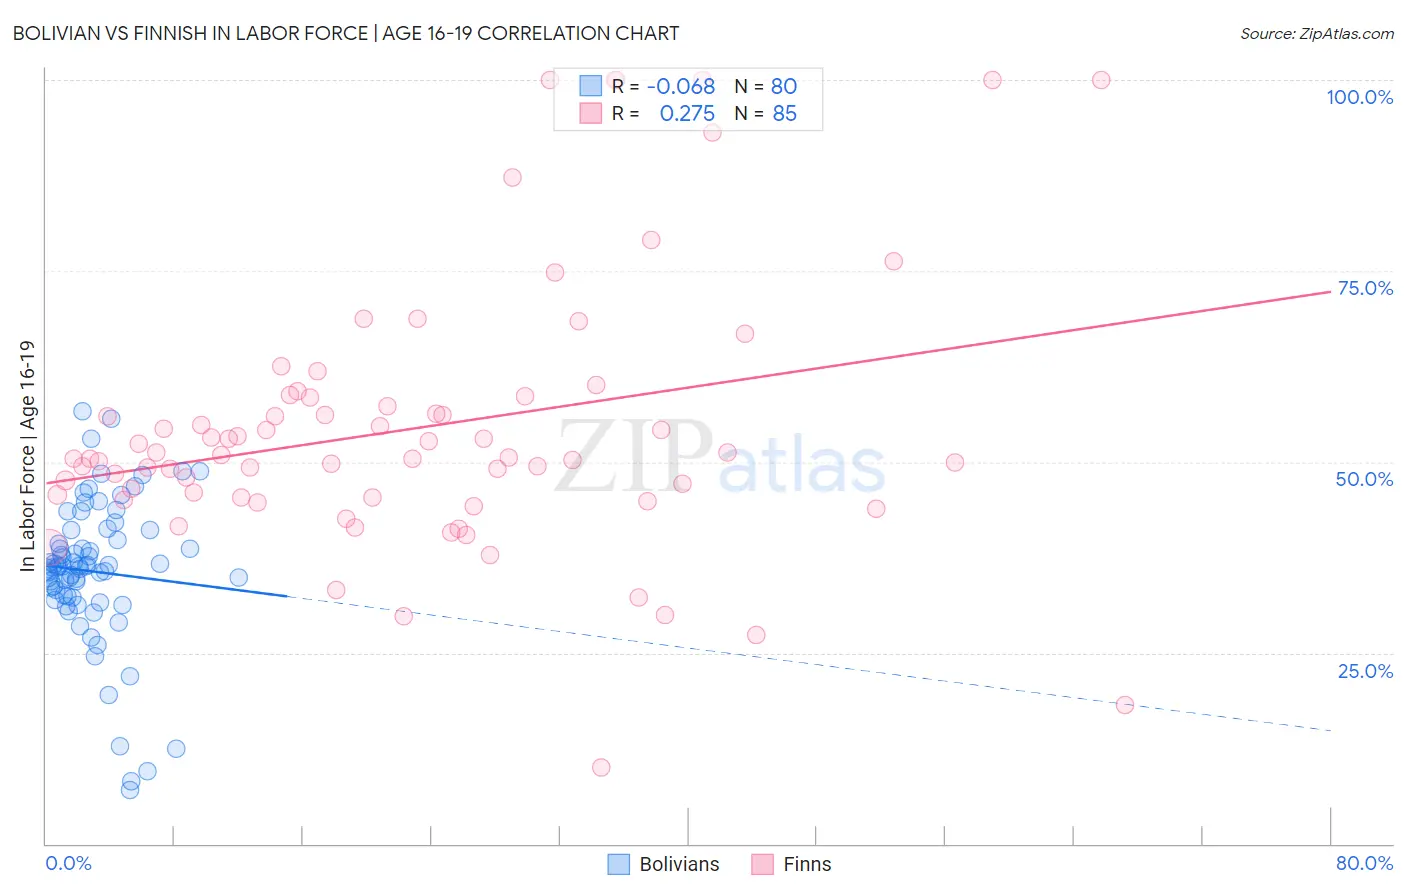
Bolivian vs Finnish In Labor Force | Age 16-19 Correlation Chart
The statistical analysis conducted on geographies consisting of 184,559,639 people shows a slight negative correlation between the proportion of Bolivians and labor force participation rate among population between the ages 16 and 19 in the United States with a correlation coefficient (R) of -0.068 and weighted average of 36.0%. Similarly, the statistical analysis conducted on geographies consisting of 403,764,919 people shows a weak positive correlation between the proportion of Finns and labor force participation rate among population between the ages 16 and 19 in the United States with a correlation coefficient (R) of 0.275 and weighted average of 43.9%, a difference of 22.0%.
In Labor Force | Age 16-19 Correlation Summary
| Measurement | Bolivian | Finnish |
| Minimum | 7.1% | 10.0% |
| Maximum | 56.7% | 100.0% |
| Range | 49.6% | 90.0% |
| Mean | 35.6% | 54.5% |
| Median | 36.3% | 50.6% |
| Interquartile 25% (IQ1) | 32.3% | 45.4% |
| Interquartile 75% (IQ3) | 40.4% | 58.5% |
| Interquartile Range (IQR) | 8.1% | 13.1% |
| Standard Deviation (Sample) | 9.5% | 17.8% |
| Standard Deviation (Population) | 9.5% | 17.7% |
Similar Demographics by In Labor Force | Age 16-19
Demographics Similar to Bolivians by In Labor Force | Age 16-19
In terms of in labor force | age 16-19, the demographic groups most similar to Bolivians are Nigerian (36.1%, a difference of 0.090%), Immigrants from Denmark (36.1%, a difference of 0.12%), Afghan (36.1%, a difference of 0.16%), Mexican American Indian (36.0%, a difference of 0.16%), and Immigrants from Serbia (36.0%, a difference of 0.17%).
| Demographics | Rating | Rank | In Labor Force | Age 16-19 |
| Immigrants | Europe | 31.8 /100 | #188 | Fair 36.2% |
| Immigrants | Hungary | 28.8 /100 | #189 | Fair 36.2% |
| Panamanians | 28.6 /100 | #190 | Fair 36.1% |
| Immigrants | Croatia | 27.5 /100 | #191 | Fair 36.1% |
| Afghans | 25.7 /100 | #192 | Fair 36.1% |
| Immigrants | Denmark | 25.0 /100 | #193 | Fair 36.1% |
| Nigerians | 24.6 /100 | #194 | Fair 36.1% |
| Bolivians | 23.3 /100 | #195 | Fair 36.0% |
| Mexican American Indians | 21.1 /100 | #196 | Fair 36.0% |
| Immigrants | Serbia | 21.0 /100 | #197 | Fair 36.0% |
| Immigrants | Northern Africa | 19.9 /100 | #198 | Poor 35.9% |
| Immigrants | Norway | 19.8 /100 | #199 | Poor 35.9% |
| Immigrants | Sweden | 18.8 /100 | #200 | Poor 35.9% |
| Alsatians | 17.5 /100 | #201 | Poor 35.9% |
| Senegalese | 17.4 /100 | #202 | Poor 35.9% |
Demographics Similar to Finns by In Labor Force | Age 16-19
In terms of in labor force | age 16-19, the demographic groups most similar to Finns are Dutch (43.8%, a difference of 0.19%), Chippewa (43.8%, a difference of 0.29%), Swedish (44.1%, a difference of 0.46%), German (44.2%, a difference of 0.54%), and Slovene (43.7%, a difference of 0.55%).
| Demographics | Rating | Rank | In Labor Force | Age 16-19 |
| Alaskan Athabascans | 100.0 /100 | #5 | Exceptional 45.2% |
| Somalis | 100.0 /100 | #6 | Exceptional 45.1% |
| Danes | 100.0 /100 | #7 | Exceptional 44.7% |
| Immigrants | Cabo Verde | 100.0 /100 | #8 | Exceptional 44.7% |
| Cape Verdeans | 100.0 /100 | #9 | Exceptional 44.5% |
| Germans | 100.0 /100 | #10 | Exceptional 44.2% |
| Swedes | 100.0 /100 | #11 | Exceptional 44.1% |
| Finns | 100.0 /100 | #12 | Exceptional 43.9% |
| Dutch | 100.0 /100 | #13 | Exceptional 43.8% |
| Chippewa | 100.0 /100 | #14 | Exceptional 43.8% |
| Slovenes | 100.0 /100 | #15 | Exceptional 43.7% |
| Czechs | 100.0 /100 | #16 | Exceptional 43.6% |
| Scandinavians | 100.0 /100 | #17 | Exceptional 43.6% |
| French Canadians | 100.0 /100 | #18 | Exceptional 43.6% |
| Belgians | 100.0 /100 | #19 | Exceptional 43.4% |