Ugandan vs Yugoslavian In Labor Force | Age 16-19
COMPARE
Ugandan
Yugoslavian
In Labor Force | Age 16-19
In Labor Force | Age 16-19 Comparison
Ugandans
Yugoslavians
38.9%
IN LABOR FORCE | AGE 16-19
99.3/ 100
METRIC RATING
98th/ 347
METRIC RANK
41.8%
IN LABOR FORCE | AGE 16-19
100.0/ 100
METRIC RATING
35th/ 347
METRIC RANK
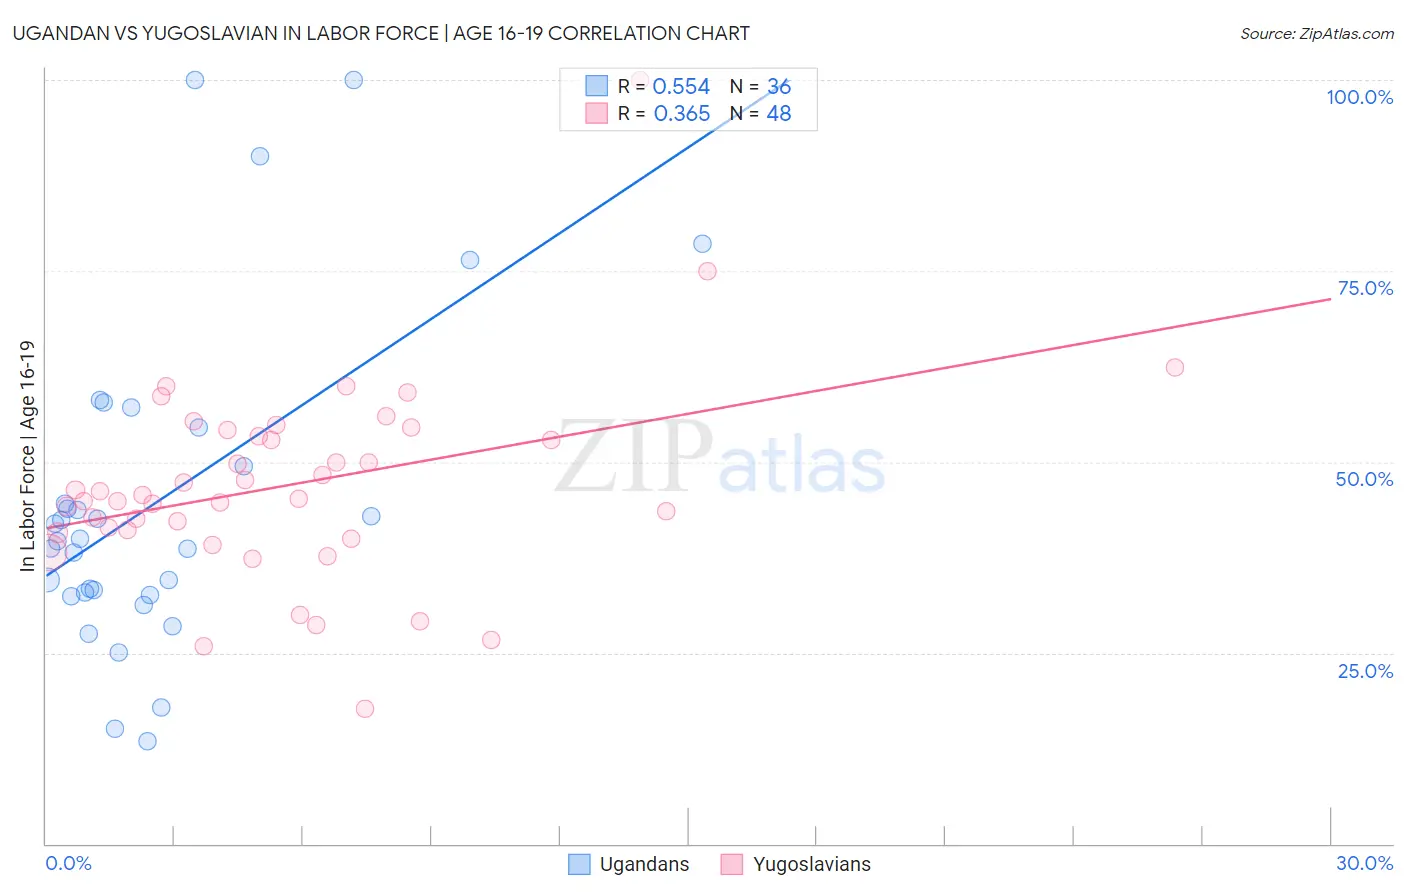
Ugandan vs Yugoslavian In Labor Force | Age 16-19 Correlation Chart
The statistical analysis conducted on geographies consisting of 94,006,992 people shows a substantial positive correlation between the proportion of Ugandans and labor force participation rate among population between the ages 16 and 19 in the United States with a correlation coefficient (R) of 0.554 and weighted average of 38.9%. Similarly, the statistical analysis conducted on geographies consisting of 285,420,048 people shows a mild positive correlation between the proportion of Yugoslavians and labor force participation rate among population between the ages 16 and 19 in the United States with a correlation coefficient (R) of 0.365 and weighted average of 41.8%, a difference of 7.5%.
In Labor Force | Age 16-19 Correlation Summary
| Measurement | Ugandan | Yugoslavian |
| Minimum | 13.5% | 17.7% |
| Maximum | 100.0% | 100.0% |
| Range | 86.5% | 82.3% |
| Mean | 44.8% | 46.9% |
| Median | 39.8% | 45.4% |
| Interquartile 25% (IQ1) | 32.7% | 40.9% |
| Interquartile 75% (IQ3) | 52.0% | 53.8% |
| Interquartile Range (IQR) | 19.3% | 12.9% |
| Standard Deviation (Sample) | 21.2% | 13.2% |
| Standard Deviation (Population) | 20.9% | 13.0% |
Similar Demographics by In Labor Force | Age 16-19
Demographics Similar to Ugandans by In Labor Force | Age 16-19
In terms of in labor force | age 16-19, the demographic groups most similar to Ugandans are Greek (38.9%, a difference of 0.010%), Immigrants from North Macedonia (38.9%, a difference of 0.020%), Latvian (38.9%, a difference of 0.050%), Immigrants from North America (38.9%, a difference of 0.080%), and Blackfeet (38.9%, a difference of 0.17%).
| Demographics | Rating | Rank | In Labor Force | Age 16-19 |
| Spanish Americans | 99.5 /100 | #91 | Exceptional 39.0% |
| Osage | 99.4 /100 | #92 | Exceptional 39.0% |
| Blackfeet | 99.4 /100 | #93 | Exceptional 38.9% |
| Immigrants | Canada | 99.4 /100 | #94 | Exceptional 38.9% |
| Immigrants | North America | 99.4 /100 | #95 | Exceptional 38.9% |
| Latvians | 99.4 /100 | #96 | Exceptional 38.9% |
| Greeks | 99.3 /100 | #97 | Exceptional 38.9% |
| Ugandans | 99.3 /100 | #98 | Exceptional 38.9% |
| Immigrants | North Macedonia | 99.3 /100 | #99 | Exceptional 38.9% |
| Immigrants | Thailand | 99.1 /100 | #100 | Exceptional 38.7% |
| Hmong | 99.1 /100 | #101 | Exceptional 38.7% |
| Zimbabweans | 99.1 /100 | #102 | Exceptional 38.7% |
| Immigrants | Cameroon | 99.0 /100 | #103 | Exceptional 38.7% |
| Immigrants | Eritrea | 99.0 /100 | #104 | Exceptional 38.7% |
| Iraqis | 98.9 /100 | #105 | Exceptional 38.6% |
Demographics Similar to Yugoslavians by In Labor Force | Age 16-19
In terms of in labor force | age 16-19, the demographic groups most similar to Yugoslavians are Immigrants from Bosnia and Herzegovina (41.8%, a difference of 0.020%), Liberian (41.8%, a difference of 0.10%), Immigrants from the Azores (41.7%, a difference of 0.14%), Immigrants from Congo (41.7%, a difference of 0.22%), and Czechoslovakian (41.9%, a difference of 0.24%).
| Demographics | Rating | Rank | In Labor Force | Age 16-19 |
| Poles | 100.0 /100 | #28 | Exceptional 42.1% |
| French | 100.0 /100 | #29 | Exceptional 42.1% |
| Scottish | 100.0 /100 | #30 | Exceptional 42.0% |
| Irish | 100.0 /100 | #31 | Exceptional 42.0% |
| Czechoslovakians | 100.0 /100 | #32 | Exceptional 41.9% |
| Liberians | 100.0 /100 | #33 | Exceptional 41.8% |
| Immigrants | Bosnia and Herzegovina | 100.0 /100 | #34 | Exceptional 41.8% |
| Yugoslavians | 100.0 /100 | #35 | Exceptional 41.8% |
| Immigrants | Azores | 100.0 /100 | #36 | Exceptional 41.7% |
| Immigrants | Congo | 100.0 /100 | #37 | Exceptional 41.7% |
| Sioux | 100.0 /100 | #38 | Exceptional 41.5% |
| Scotch-Irish | 100.0 /100 | #39 | Exceptional 41.5% |
| Immigrants | Liberia | 100.0 /100 | #40 | Exceptional 41.5% |
| Celtics | 100.0 /100 | #41 | Exceptional 41.3% |
| Whites/Caucasians | 100.0 /100 | #42 | Exceptional 41.3% |