Ugandan vs Immigrants from Malaysia Nursery School
COMPARE
Ugandan
Immigrants from Malaysia
Nursery School
Nursery School Comparison
Ugandans
Immigrants from Malaysia
98.0%
NURSERY SCHOOL
56.4/ 100
METRIC RATING
164th/ 347
METRIC RANK
97.7%
NURSERY SCHOOL
1.9/ 100
METRIC RATING
236th/ 347
METRIC RANK
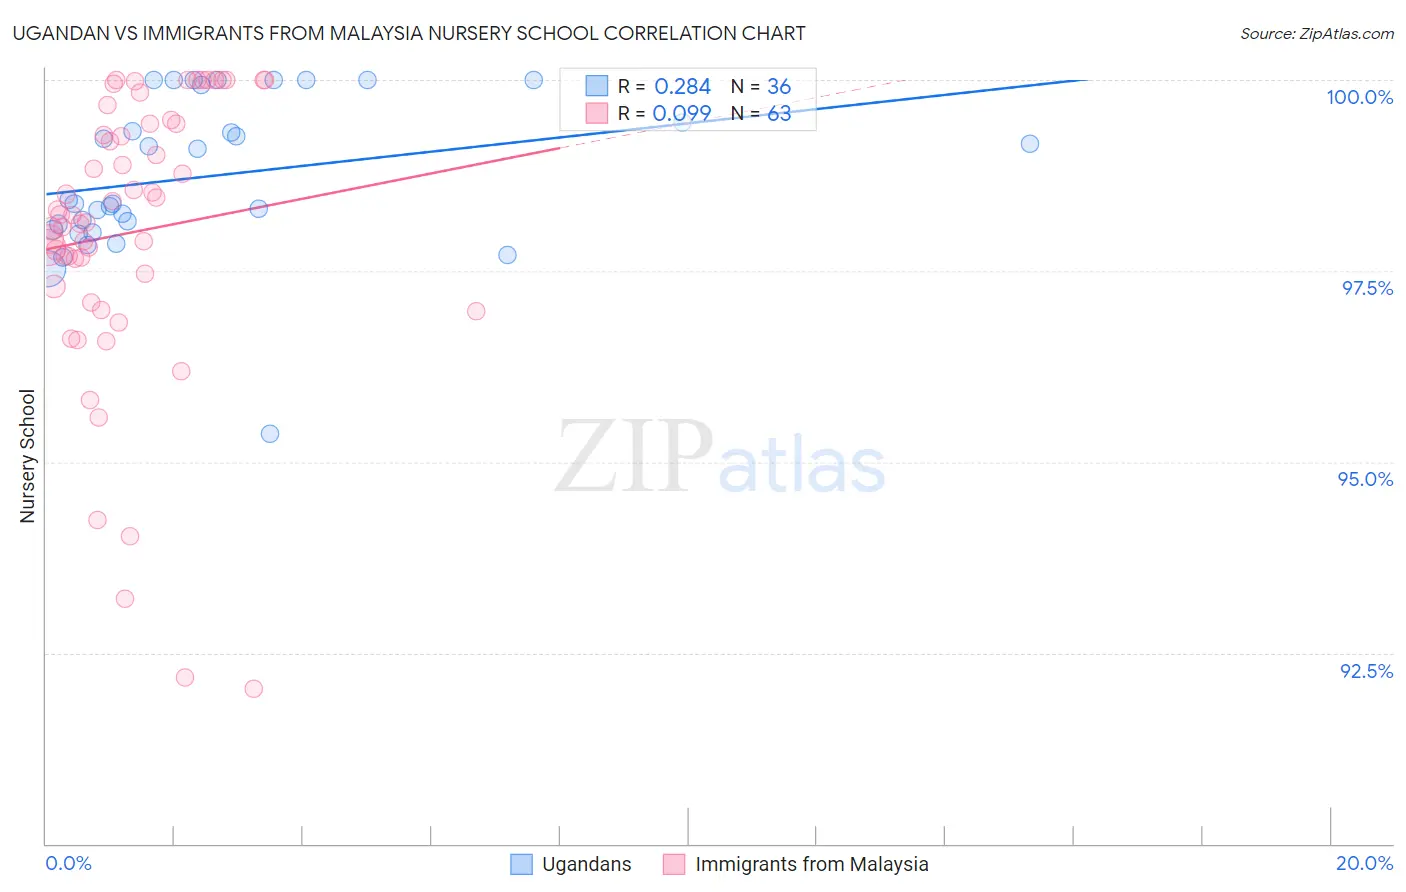
Ugandan vs Immigrants from Malaysia Nursery School Correlation Chart
The statistical analysis conducted on geographies consisting of 93,991,892 people shows a weak positive correlation between the proportion of Ugandans and percentage of population with at least nursery school education in the United States with a correlation coefficient (R) of 0.284 and weighted average of 98.0%. Similarly, the statistical analysis conducted on geographies consisting of 197,973,709 people shows a slight positive correlation between the proportion of Immigrants from Malaysia and percentage of population with at least nursery school education in the United States with a correlation coefficient (R) of 0.099 and weighted average of 97.7%, a difference of 0.31%.
Nursery School Correlation Summary
| Measurement | Ugandan | Immigrants from Malaysia |
| Minimum | 95.4% | 92.0% |
| Maximum | 100.0% | 100.0% |
| Range | 4.6% | 8.0% |
| Mean | 98.7% | 98.0% |
| Median | 98.4% | 98.2% |
| Interquartile 25% (IQ1) | 98.1% | 97.3% |
| Interquartile 75% (IQ3) | 99.7% | 99.4% |
| Interquartile Range (IQR) | 1.6% | 2.1% |
| Standard Deviation (Sample) | 1.0% | 1.9% |
| Standard Deviation (Population) | 1.0% | 1.9% |
Similar Demographics by Nursery School
Demographics Similar to Ugandans by Nursery School
In terms of nursery school, the demographic groups most similar to Ugandans are Chilean (98.0%, a difference of 0.0%), Spanish American (98.0%, a difference of 0.0%), Immigrants from Spain (98.0%, a difference of 0.0%), Immigrants from Micronesia (98.0%, a difference of 0.0%), and Immigrants from Russia (98.0%, a difference of 0.010%).
| Demographics | Rating | Rank | Nursery School |
| Comanche | 66.0 /100 | #157 | Good 98.0% |
| Immigrants | North Macedonia | 65.7 /100 | #158 | Good 98.0% |
| French American Indians | 62.1 /100 | #159 | Good 98.0% |
| Immigrants | Russia | 59.9 /100 | #160 | Average 98.0% |
| Immigrants | Eastern Europe | 59.7 /100 | #161 | Average 98.0% |
| Brazilians | 59.4 /100 | #162 | Average 98.0% |
| Immigrants | Italy | 59.0 /100 | #163 | Average 98.0% |
| Ugandans | 56.4 /100 | #164 | Average 98.0% |
| Chileans | 56.4 /100 | #165 | Average 98.0% |
| Spanish Americans | 55.6 /100 | #166 | Average 98.0% |
| Immigrants | Spain | 55.6 /100 | #167 | Average 98.0% |
| Immigrants | Micronesia | 55.0 /100 | #168 | Average 98.0% |
| Immigrants | Korea | 53.8 /100 | #169 | Average 98.0% |
| Bermudans | 53.7 /100 | #170 | Average 98.0% |
| Immigrants | Jordan | 53.4 /100 | #171 | Average 98.0% |
Demographics Similar to Immigrants from Malaysia by Nursery School
In terms of nursery school, the demographic groups most similar to Immigrants from Malaysia are Immigrants from Western Asia (97.7%, a difference of 0.0%), Immigrants from Uruguay (97.7%, a difference of 0.010%), U.S. Virgin Islander (97.7%, a difference of 0.010%), Colombian (97.7%, a difference of 0.010%), and Immigrants from Pakistan (97.7%, a difference of 0.010%).
| Demographics | Rating | Rank | Nursery School |
| Senegalese | 3.2 /100 | #229 | Tragic 97.7% |
| Sierra Leoneans | 2.9 /100 | #230 | Tragic 97.7% |
| Puerto Ricans | 2.6 /100 | #231 | Tragic 97.7% |
| Immigrants | Uruguay | 2.3 /100 | #232 | Tragic 97.7% |
| U.S. Virgin Islanders | 2.1 /100 | #233 | Tragic 97.7% |
| Colombians | 2.1 /100 | #234 | Tragic 97.7% |
| Immigrants | Pakistan | 2.1 /100 | #235 | Tragic 97.7% |
| Immigrants | Malaysia | 1.9 /100 | #236 | Tragic 97.7% |
| Immigrants | Western Asia | 1.9 /100 | #237 | Tragic 97.7% |
| Nigerians | 1.7 /100 | #238 | Tragic 97.7% |
| Immigrants | Eastern Asia | 1.6 /100 | #239 | Tragic 97.7% |
| Koreans | 1.4 /100 | #240 | Tragic 97.7% |
| Immigrants | Indonesia | 1.1 /100 | #241 | Tragic 97.7% |
| Liberians | 1.1 /100 | #242 | Tragic 97.7% |
| Asians | 1.1 /100 | #243 | Tragic 97.6% |