Immigrants from Central America vs French American Indian In Labor Force | Age 20-64
COMPARE
Immigrants from Central America
French American Indian
In Labor Force | Age 20-64
In Labor Force | Age 20-64 Comparison
Immigrants from Central America
French American Indians
77.7%
IN LABOR FORCE | AGE 20-64
0.0/ 100
METRIC RATING
294th/ 347
METRIC RANK
78.2%
IN LABOR FORCE | AGE 20-64
0.0/ 100
METRIC RATING
273rd/ 347
METRIC RANK
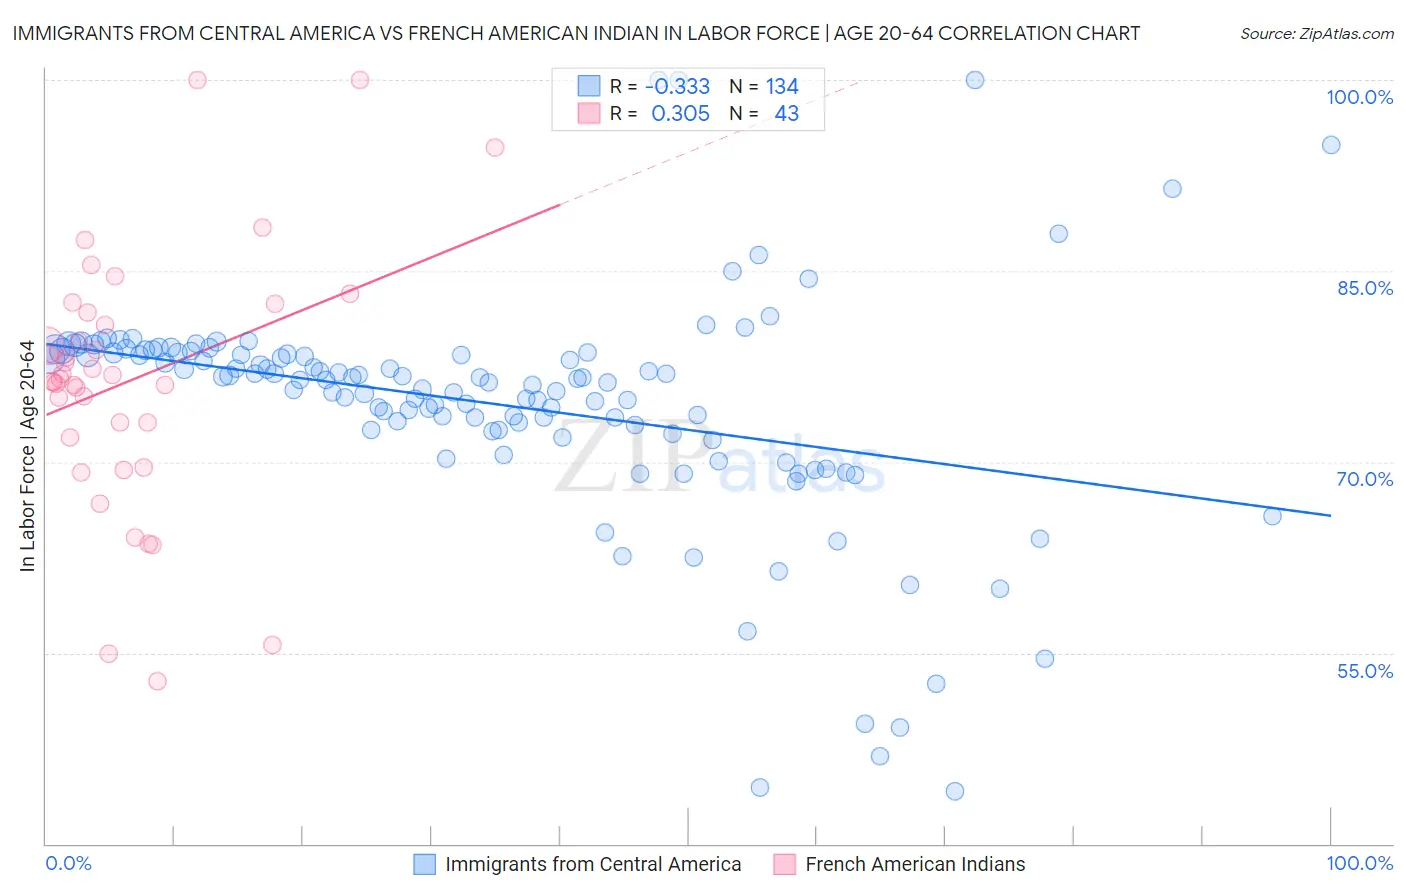
Immigrants from Central America vs French American Indian In Labor Force | Age 20-64 Correlation Chart
The statistical analysis conducted on geographies consisting of 536,506,208 people shows a mild negative correlation between the proportion of Immigrants from Central America and labor force participation rate among population between the ages 20 and 64 in the United States with a correlation coefficient (R) of -0.333 and weighted average of 77.7%. Similarly, the statistical analysis conducted on geographies consisting of 131,974,215 people shows a mild positive correlation between the proportion of French American Indians and labor force participation rate among population between the ages 20 and 64 in the United States with a correlation coefficient (R) of 0.305 and weighted average of 78.2%, a difference of 0.66%.
In Labor Force | Age 20-64 Correlation Summary
| Measurement | Immigrants from Central America | French American Indian |
| Minimum | 44.1% | 52.8% |
| Maximum | 100.0% | 100.0% |
| Range | 55.9% | 47.2% |
| Mean | 74.5% | 76.4% |
| Median | 76.5% | 76.5% |
| Interquartile 25% (IQ1) | 72.5% | 71.9% |
| Interquartile 75% (IQ3) | 78.6% | 81.7% |
| Interquartile Range (IQR) | 6.1% | 9.8% |
| Standard Deviation (Sample) | 9.0% | 10.1% |
| Standard Deviation (Population) | 9.0% | 10.0% |
Similar Demographics by In Labor Force | Age 20-64
Demographics Similar to Immigrants from Central America by In Labor Force | Age 20-64
In terms of in labor force | age 20-64, the demographic groups most similar to Immigrants from Central America are Immigrants from Grenada (77.7%, a difference of 0.030%), Immigrants from Dominican Republic (77.7%, a difference of 0.070%), Dominican (77.7%, a difference of 0.070%), Cree (77.7%, a difference of 0.080%), and Delaware (77.8%, a difference of 0.090%).
| Demographics | Rating | Rank | In Labor Force | Age 20-64 |
| Vietnamese | 0.0 /100 | #287 | Tragic 78.0% |
| Hmong | 0.0 /100 | #288 | Tragic 77.9% |
| Africans | 0.0 /100 | #289 | Tragic 77.9% |
| Immigrants | Bangladesh | 0.0 /100 | #290 | Tragic 77.9% |
| Spanish Americans | 0.0 /100 | #291 | Tragic 77.8% |
| Immigrants | Azores | 0.0 /100 | #292 | Tragic 77.8% |
| Delaware | 0.0 /100 | #293 | Tragic 77.8% |
| Immigrants | Central America | 0.0 /100 | #294 | Tragic 77.7% |
| Immigrants | Grenada | 0.0 /100 | #295 | Tragic 77.7% |
| Immigrants | Dominican Republic | 0.0 /100 | #296 | Tragic 77.7% |
| Dominicans | 0.0 /100 | #297 | Tragic 77.7% |
| Cree | 0.0 /100 | #298 | Tragic 77.7% |
| Hispanics or Latinos | 0.0 /100 | #299 | Tragic 77.6% |
| Spanish American Indians | 0.0 /100 | #300 | Tragic 77.6% |
| Nepalese | 0.0 /100 | #301 | Tragic 77.5% |
Demographics Similar to French American Indians by In Labor Force | Age 20-64
In terms of in labor force | age 20-64, the demographic groups most similar to French American Indians are Aleut (78.2%, a difference of 0.020%), Spanish (78.2%, a difference of 0.030%), Puget Sound Salish (78.2%, a difference of 0.030%), Marshallese (78.3%, a difference of 0.040%), and Immigrants from Latin America (78.3%, a difference of 0.050%).
| Demographics | Rating | Rank | In Labor Force | Age 20-64 |
| Bahamians | 0.1 /100 | #266 | Tragic 78.4% |
| U.S. Virgin Islanders | 0.1 /100 | #267 | Tragic 78.4% |
| West Indians | 0.0 /100 | #268 | Tragic 78.3% |
| Immigrants | Barbados | 0.0 /100 | #269 | Tragic 78.3% |
| Scotch-Irish | 0.0 /100 | #270 | Tragic 78.3% |
| Immigrants | Latin America | 0.0 /100 | #271 | Tragic 78.3% |
| Marshallese | 0.0 /100 | #272 | Tragic 78.3% |
| French American Indians | 0.0 /100 | #273 | Tragic 78.2% |
| Aleuts | 0.0 /100 | #274 | Tragic 78.2% |
| Spanish | 0.0 /100 | #275 | Tragic 78.2% |
| Puget Sound Salish | 0.0 /100 | #276 | Tragic 78.2% |
| Immigrants | Bahamas | 0.0 /100 | #277 | Tragic 78.2% |
| Mexican American Indians | 0.0 /100 | #278 | Tragic 78.2% |
| Belizeans | 0.0 /100 | #279 | Tragic 78.2% |
| Immigrants | Dominica | 0.0 /100 | #280 | Tragic 78.1% |