Immigrants from Micronesia vs French American Indian In Labor Force | Age 20-64
COMPARE
Immigrants from Micronesia
French American Indian
In Labor Force | Age 20-64
In Labor Force | Age 20-64 Comparison
Immigrants from Micronesia
French American Indians
78.9%
IN LABOR FORCE | AGE 20-64
1.9/ 100
METRIC RATING
242nd/ 347
METRIC RANK
78.2%
IN LABOR FORCE | AGE 20-64
0.0/ 100
METRIC RATING
273rd/ 347
METRIC RANK
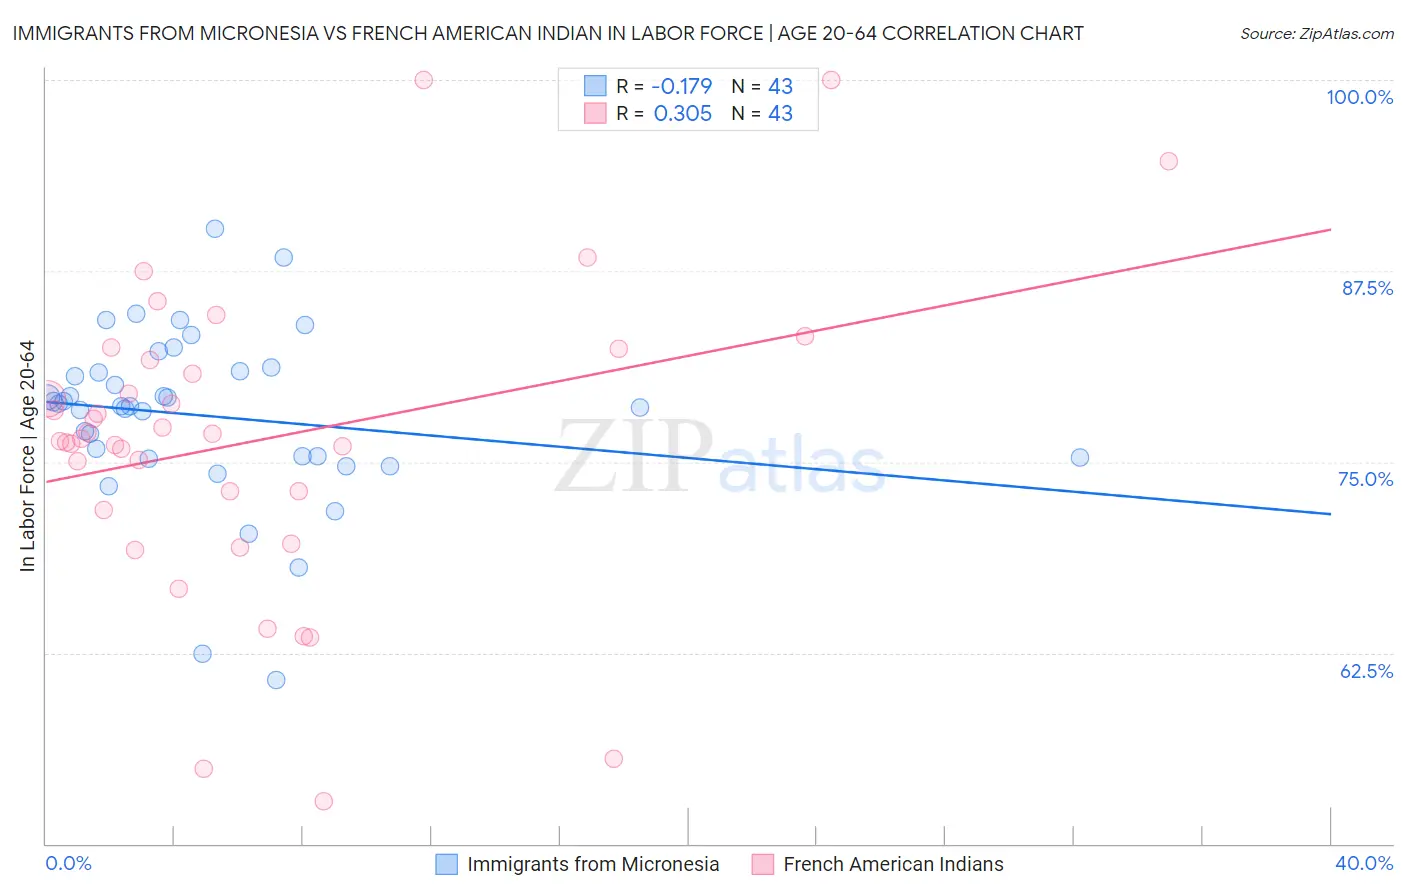
Immigrants from Micronesia vs French American Indian In Labor Force | Age 20-64 Correlation Chart
The statistical analysis conducted on geographies consisting of 61,600,666 people shows a poor negative correlation between the proportion of Immigrants from Micronesia and labor force participation rate among population between the ages 20 and 64 in the United States with a correlation coefficient (R) of -0.179 and weighted average of 78.9%. Similarly, the statistical analysis conducted on geographies consisting of 131,974,215 people shows a mild positive correlation between the proportion of French American Indians and labor force participation rate among population between the ages 20 and 64 in the United States with a correlation coefficient (R) of 0.305 and weighted average of 78.2%, a difference of 0.90%.
In Labor Force | Age 20-64 Correlation Summary
| Measurement | Immigrants from Micronesia | French American Indian |
| Minimum | 60.7% | 52.8% |
| Maximum | 90.3% | 100.0% |
| Range | 29.6% | 47.2% |
| Mean | 78.0% | 76.4% |
| Median | 78.7% | 76.5% |
| Interquartile 25% (IQ1) | 75.3% | 71.9% |
| Interquartile 75% (IQ3) | 80.9% | 81.7% |
| Interquartile Range (IQR) | 5.6% | 9.8% |
| Standard Deviation (Sample) | 5.7% | 10.1% |
| Standard Deviation (Population) | 5.6% | 10.0% |
Similar Demographics by In Labor Force | Age 20-64
Demographics Similar to Immigrants from Micronesia by In Labor Force | Age 20-64
In terms of in labor force | age 20-64, the demographic groups most similar to Immigrants from Micronesia are Jamaican (78.9%, a difference of 0.010%), Immigrants from West Indies (78.9%, a difference of 0.020%), Welsh (79.0%, a difference of 0.040%), Trinidadian and Tobagonian (79.0%, a difference of 0.040%), and French (78.9%, a difference of 0.050%).
| Demographics | Rating | Rank | In Labor Force | Age 20-64 |
| Tlingit-Haida | 3.2 /100 | #235 | Tragic 79.0% |
| Samoans | 2.9 /100 | #236 | Tragic 79.0% |
| Immigrants | North America | 2.9 /100 | #237 | Tragic 79.0% |
| Immigrants | Jamaica | 2.6 /100 | #238 | Tragic 79.0% |
| Welsh | 2.4 /100 | #239 | Tragic 79.0% |
| Trinidadians and Tobagonians | 2.3 /100 | #240 | Tragic 79.0% |
| Jamaicans | 2.0 /100 | #241 | Tragic 78.9% |
| Immigrants | Micronesia | 1.9 /100 | #242 | Tragic 78.9% |
| Immigrants | West Indies | 1.7 /100 | #243 | Tragic 78.9% |
| French | 1.5 /100 | #244 | Tragic 78.9% |
| Scottish | 1.3 /100 | #245 | Tragic 78.9% |
| Immigrants | Trinidad and Tobago | 1.1 /100 | #246 | Tragic 78.8% |
| Immigrants | Germany | 1.0 /100 | #247 | Tragic 78.8% |
| Immigrants | Caribbean | 1.0 /100 | #248 | Tragic 78.8% |
| English | 0.9 /100 | #249 | Tragic 78.8% |
Demographics Similar to French American Indians by In Labor Force | Age 20-64
In terms of in labor force | age 20-64, the demographic groups most similar to French American Indians are Aleut (78.2%, a difference of 0.020%), Spanish (78.2%, a difference of 0.030%), Puget Sound Salish (78.2%, a difference of 0.030%), Marshallese (78.3%, a difference of 0.040%), and Immigrants from Latin America (78.3%, a difference of 0.050%).
| Demographics | Rating | Rank | In Labor Force | Age 20-64 |
| Bahamians | 0.1 /100 | #266 | Tragic 78.4% |
| U.S. Virgin Islanders | 0.1 /100 | #267 | Tragic 78.4% |
| West Indians | 0.0 /100 | #268 | Tragic 78.3% |
| Immigrants | Barbados | 0.0 /100 | #269 | Tragic 78.3% |
| Scotch-Irish | 0.0 /100 | #270 | Tragic 78.3% |
| Immigrants | Latin America | 0.0 /100 | #271 | Tragic 78.3% |
| Marshallese | 0.0 /100 | #272 | Tragic 78.3% |
| French American Indians | 0.0 /100 | #273 | Tragic 78.2% |
| Aleuts | 0.0 /100 | #274 | Tragic 78.2% |
| Spanish | 0.0 /100 | #275 | Tragic 78.2% |
| Puget Sound Salish | 0.0 /100 | #276 | Tragic 78.2% |
| Immigrants | Bahamas | 0.0 /100 | #277 | Tragic 78.2% |
| Mexican American Indians | 0.0 /100 | #278 | Tragic 78.2% |
| Belizeans | 0.0 /100 | #279 | Tragic 78.2% |
| Immigrants | Dominica | 0.0 /100 | #280 | Tragic 78.1% |