Immigrants from Sri Lanka vs French American Indian In Labor Force | Age 20-64
COMPARE
Immigrants from Sri Lanka
French American Indian
In Labor Force | Age 20-64
In Labor Force | Age 20-64 Comparison
Immigrants from Sri Lanka
French American Indians
80.4%
IN LABOR FORCE | AGE 20-64
99.3/ 100
METRIC RATING
51st/ 347
METRIC RANK
78.2%
IN LABOR FORCE | AGE 20-64
0.0/ 100
METRIC RATING
273rd/ 347
METRIC RANK
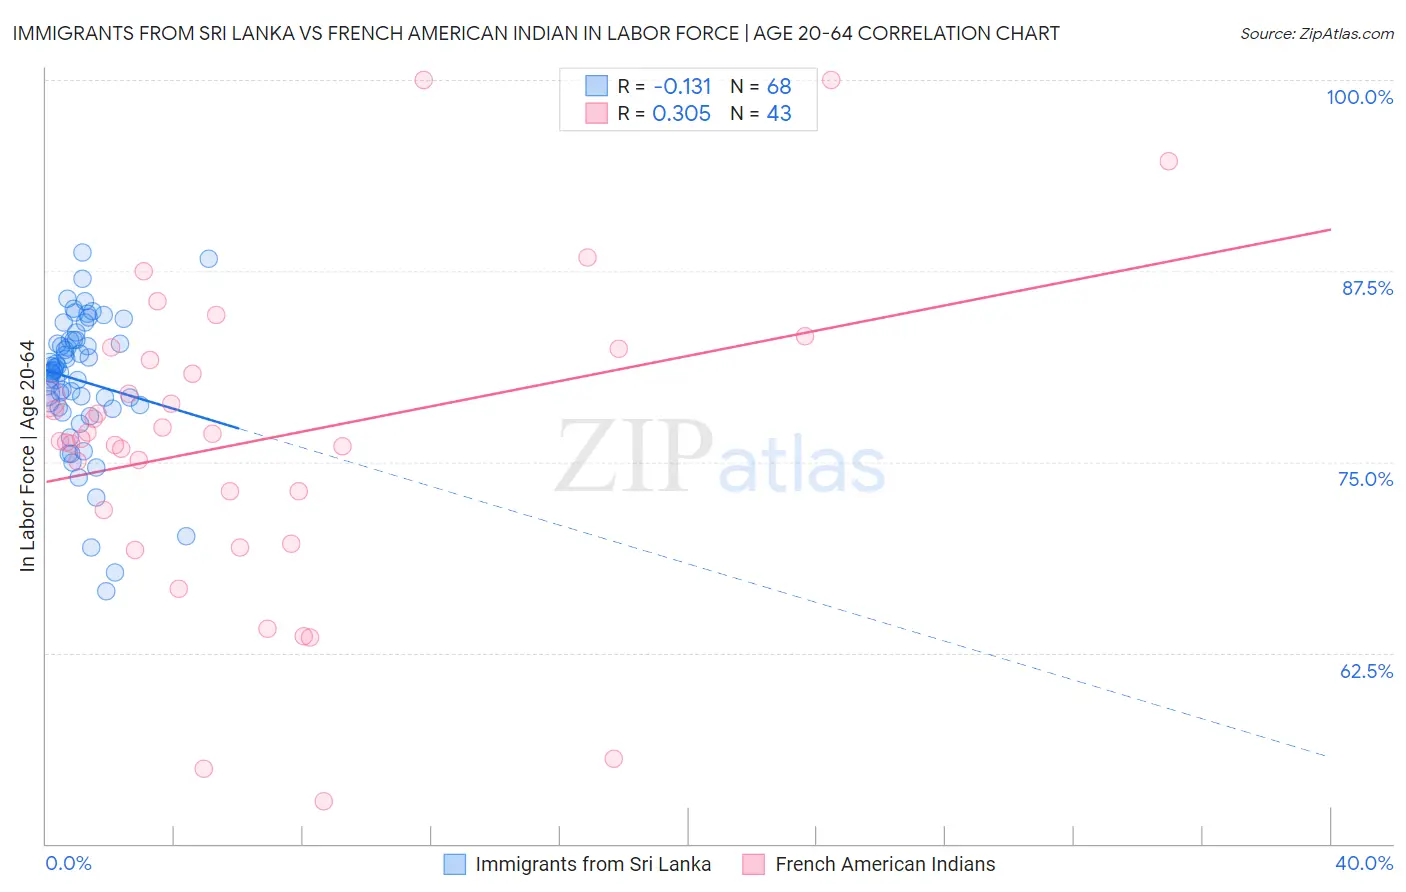
Immigrants from Sri Lanka vs French American Indian In Labor Force | Age 20-64 Correlation Chart
The statistical analysis conducted on geographies consisting of 149,698,668 people shows a poor negative correlation between the proportion of Immigrants from Sri Lanka and labor force participation rate among population between the ages 20 and 64 in the United States with a correlation coefficient (R) of -0.131 and weighted average of 80.4%. Similarly, the statistical analysis conducted on geographies consisting of 131,974,215 people shows a mild positive correlation between the proportion of French American Indians and labor force participation rate among population between the ages 20 and 64 in the United States with a correlation coefficient (R) of 0.305 and weighted average of 78.2%, a difference of 2.7%.
In Labor Force | Age 20-64 Correlation Summary
| Measurement | Immigrants from Sri Lanka | French American Indian |
| Minimum | 66.5% | 52.8% |
| Maximum | 88.7% | 100.0% |
| Range | 22.2% | 47.2% |
| Mean | 80.3% | 76.4% |
| Median | 81.0% | 76.5% |
| Interquartile 25% (IQ1) | 78.6% | 71.9% |
| Interquartile 75% (IQ3) | 83.0% | 81.7% |
| Interquartile Range (IQR) | 4.3% | 9.8% |
| Standard Deviation (Sample) | 4.4% | 10.1% |
| Standard Deviation (Population) | 4.4% | 10.0% |
Similar Demographics by In Labor Force | Age 20-64
Demographics Similar to Immigrants from Sri Lanka by In Labor Force | Age 20-64
In terms of in labor force | age 20-64, the demographic groups most similar to Immigrants from Sri Lanka are Turkish (80.3%, a difference of 0.020%), Immigrants from Sudan (80.4%, a difference of 0.030%), Immigrants from Peru (80.3%, a difference of 0.030%), Immigrants from Greece (80.4%, a difference of 0.040%), and Peruvian (80.3%, a difference of 0.040%).
| Demographics | Rating | Rank | In Labor Force | Age 20-64 |
| Immigrants | Middle Africa | 99.7 /100 | #44 | Exceptional 80.5% |
| Slovenes | 99.7 /100 | #45 | Exceptional 80.5% |
| Immigrants | Pakistan | 99.6 /100 | #46 | Exceptional 80.5% |
| Immigrants | Africa | 99.6 /100 | #47 | Exceptional 80.4% |
| Immigrants | Hong Kong | 99.5 /100 | #48 | Exceptional 80.4% |
| Immigrants | Greece | 99.4 /100 | #49 | Exceptional 80.4% |
| Immigrants | Sudan | 99.4 /100 | #50 | Exceptional 80.4% |
| Immigrants | Sri Lanka | 99.3 /100 | #51 | Exceptional 80.4% |
| Turks | 99.2 /100 | #52 | Exceptional 80.3% |
| Immigrants | Peru | 99.2 /100 | #53 | Exceptional 80.3% |
| Peruvians | 99.1 /100 | #54 | Exceptional 80.3% |
| Immigrants | Cabo Verde | 99.0 /100 | #55 | Exceptional 80.3% |
| Immigrants | Northern Africa | 99.0 /100 | #56 | Exceptional 80.3% |
| Afghans | 98.9 /100 | #57 | Exceptional 80.3% |
| Serbians | 98.9 /100 | #58 | Exceptional 80.3% |
Demographics Similar to French American Indians by In Labor Force | Age 20-64
In terms of in labor force | age 20-64, the demographic groups most similar to French American Indians are Aleut (78.2%, a difference of 0.020%), Spanish (78.2%, a difference of 0.030%), Puget Sound Salish (78.2%, a difference of 0.030%), Marshallese (78.3%, a difference of 0.040%), and Immigrants from Latin America (78.3%, a difference of 0.050%).
| Demographics | Rating | Rank | In Labor Force | Age 20-64 |
| Bahamians | 0.1 /100 | #266 | Tragic 78.4% |
| U.S. Virgin Islanders | 0.1 /100 | #267 | Tragic 78.4% |
| West Indians | 0.0 /100 | #268 | Tragic 78.3% |
| Immigrants | Barbados | 0.0 /100 | #269 | Tragic 78.3% |
| Scotch-Irish | 0.0 /100 | #270 | Tragic 78.3% |
| Immigrants | Latin America | 0.0 /100 | #271 | Tragic 78.3% |
| Marshallese | 0.0 /100 | #272 | Tragic 78.3% |
| French American Indians | 0.0 /100 | #273 | Tragic 78.2% |
| Aleuts | 0.0 /100 | #274 | Tragic 78.2% |
| Spanish | 0.0 /100 | #275 | Tragic 78.2% |
| Puget Sound Salish | 0.0 /100 | #276 | Tragic 78.2% |
| Immigrants | Bahamas | 0.0 /100 | #277 | Tragic 78.2% |
| Mexican American Indians | 0.0 /100 | #278 | Tragic 78.2% |
| Belizeans | 0.0 /100 | #279 | Tragic 78.2% |
| Immigrants | Dominica | 0.0 /100 | #280 | Tragic 78.1% |