Tsimshian vs Pueblo In Labor Force | Age 35-44
COMPARE
Tsimshian
Pueblo
In Labor Force | Age 35-44
In Labor Force | Age 35-44 Comparison
Tsimshian
Pueblo
83.5%
IN LABOR FORCE | AGE 35-44
0.2/ 100
METRIC RATING
258th/ 347
METRIC RANK
77.4%
IN LABOR FORCE | AGE 35-44
0.0/ 100
METRIC RATING
338th/ 347
METRIC RANK
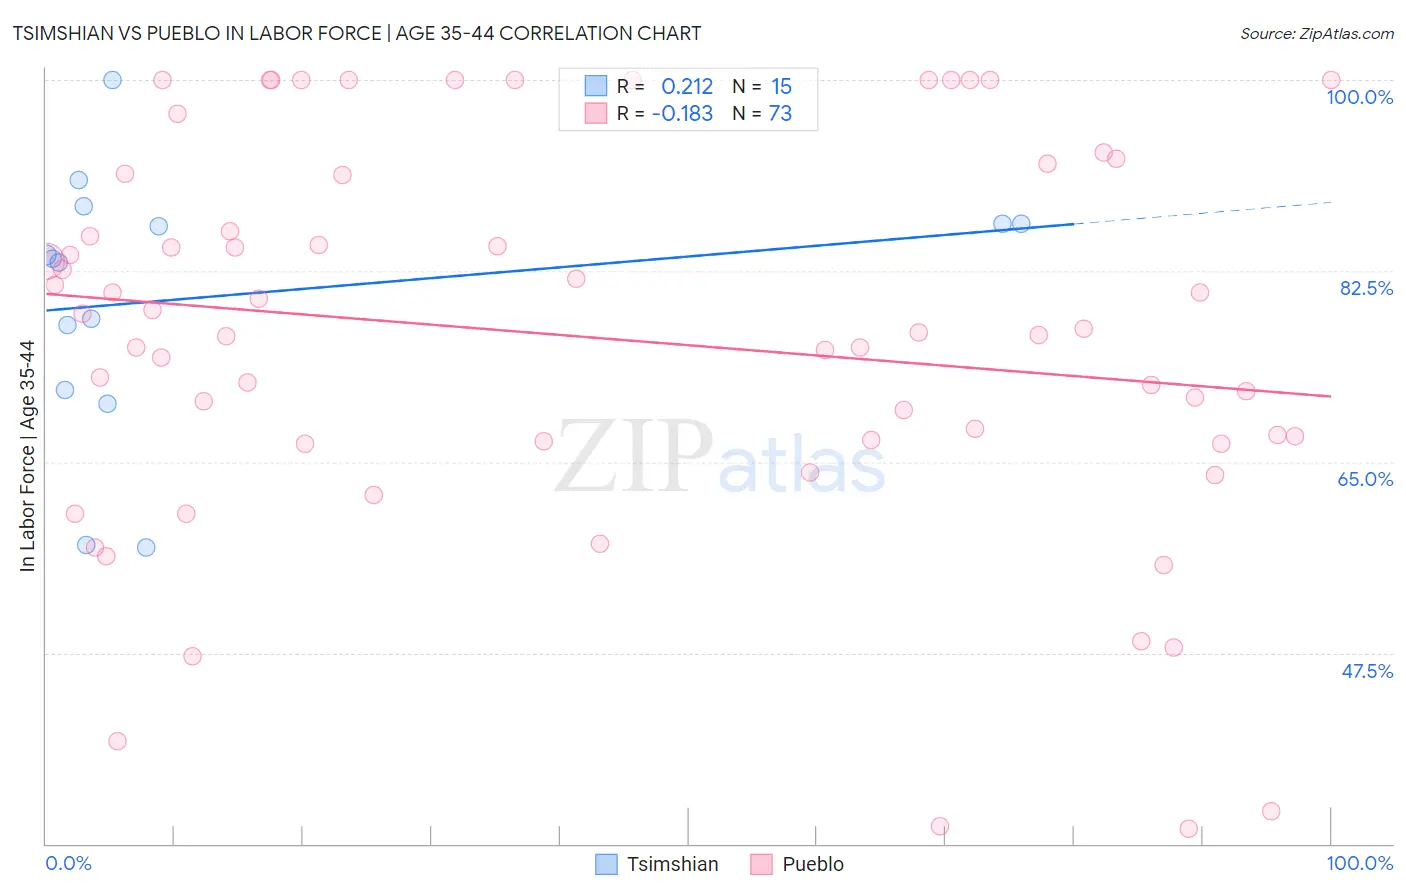
Tsimshian vs Pueblo In Labor Force | Age 35-44 Correlation Chart
The statistical analysis conducted on geographies consisting of 15,626,462 people shows a weak positive correlation between the proportion of Tsimshian and labor force participation rate among population between the ages 35 and 44 in the United States with a correlation coefficient (R) of 0.212 and weighted average of 83.5%. Similarly, the statistical analysis conducted on geographies consisting of 120,075,007 people shows a poor negative correlation between the proportion of Pueblo and labor force participation rate among population between the ages 35 and 44 in the United States with a correlation coefficient (R) of -0.183 and weighted average of 77.4%, a difference of 8.0%.
In Labor Force | Age 35-44 Correlation Summary
| Measurement | Tsimshian | Pueblo |
| Minimum | 57.1% | 31.4% |
| Maximum | 100.0% | 100.0% |
| Range | 42.9% | 68.6% |
| Mean | 80.2% | 76.4% |
| Median | 83.6% | 76.9% |
| Interquartile 25% (IQ1) | 71.6% | 66.8% |
| Interquartile 75% (IQ3) | 86.8% | 91.3% |
| Interquartile Range (IQR) | 15.2% | 24.6% |
| Standard Deviation (Sample) | 11.9% | 17.8% |
| Standard Deviation (Population) | 11.5% | 17.7% |
Similar Demographics by In Labor Force | Age 35-44
Demographics Similar to Tsimshian by In Labor Force | Age 35-44
In terms of in labor force | age 35-44, the demographic groups most similar to Tsimshian are Basque (83.6%, a difference of 0.020%), Immigrants from El Salvador (83.5%, a difference of 0.020%), Vietnamese (83.5%, a difference of 0.030%), Japanese (83.6%, a difference of 0.040%), and Immigrants from Dominica (83.5%, a difference of 0.040%).
| Demographics | Rating | Rank | In Labor Force | Age 35-44 |
| Salvadorans | 0.4 /100 | #251 | Tragic 83.6% |
| Immigrants | Guyana | 0.4 /100 | #252 | Tragic 83.6% |
| Lebanese | 0.4 /100 | #253 | Tragic 83.6% |
| Tongans | 0.4 /100 | #254 | Tragic 83.6% |
| Immigrants | Azores | 0.3 /100 | #255 | Tragic 83.6% |
| Japanese | 0.3 /100 | #256 | Tragic 83.6% |
| Basques | 0.3 /100 | #257 | Tragic 83.6% |
| Tsimshian | 0.2 /100 | #258 | Tragic 83.5% |
| Immigrants | El Salvador | 0.2 /100 | #259 | Tragic 83.5% |
| Vietnamese | 0.2 /100 | #260 | Tragic 83.5% |
| Immigrants | Dominica | 0.2 /100 | #261 | Tragic 83.5% |
| Immigrants | Congo | 0.2 /100 | #262 | Tragic 83.5% |
| Iroquois | 0.2 /100 | #263 | Tragic 83.5% |
| Scotch-Irish | 0.1 /100 | #264 | Tragic 83.5% |
| Central Americans | 0.1 /100 | #265 | Tragic 83.5% |
Demographics Similar to Pueblo by In Labor Force | Age 35-44
In terms of in labor force | age 35-44, the demographic groups most similar to Pueblo are Yup'ik (77.3%, a difference of 0.10%), Lumbee (77.0%, a difference of 0.46%), Hopi (77.0%, a difference of 0.50%), Apache (77.9%, a difference of 0.70%), and Arapaho (78.1%, a difference of 0.91%).
| Demographics | Rating | Rank | In Labor Force | Age 35-44 |
| Houma | 0.0 /100 | #331 | Tragic 79.5% |
| Ute | 0.0 /100 | #332 | Tragic 79.4% |
| Kiowa | 0.0 /100 | #333 | Tragic 79.2% |
| Yakama | 0.0 /100 | #334 | Tragic 79.0% |
| Natives/Alaskans | 0.0 /100 | #335 | Tragic 78.9% |
| Arapaho | 0.0 /100 | #336 | Tragic 78.1% |
| Apache | 0.0 /100 | #337 | Tragic 77.9% |
| Pueblo | 0.0 /100 | #338 | Tragic 77.4% |
| Yup'ik | 0.0 /100 | #339 | Tragic 77.3% |
| Lumbee | 0.0 /100 | #340 | Tragic 77.0% |
| Hopi | 0.0 /100 | #341 | Tragic 77.0% |
| Crow | 0.0 /100 | #342 | Tragic 76.5% |
| Immigrants | Yemen | 0.0 /100 | #343 | Tragic 76.3% |
| Pima | 0.0 /100 | #344 | Tragic 74.8% |
| Yuman | 0.0 /100 | #345 | Tragic 74.7% |