Tsimshian vs Syrian In Labor Force | Age 35-44
COMPARE
Tsimshian
Syrian
In Labor Force | Age 35-44
In Labor Force | Age 35-44 Comparison
Tsimshian
Syrians
83.5%
IN LABOR FORCE | AGE 35-44
0.2/ 100
METRIC RATING
258th/ 347
METRIC RANK
84.2%
IN LABOR FORCE | AGE 35-44
23.2/ 100
METRIC RATING
199th/ 347
METRIC RANK
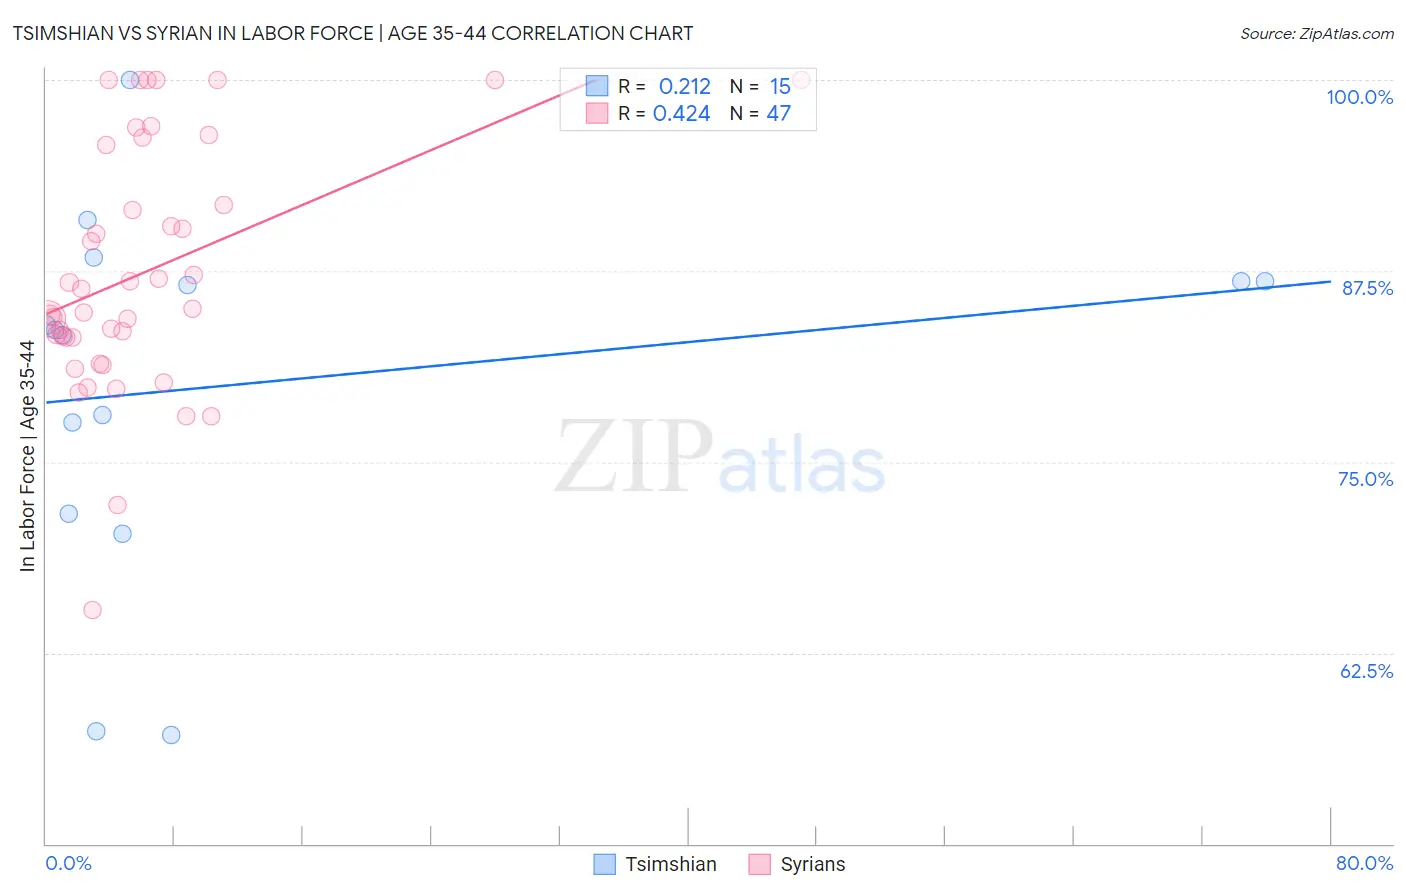
Tsimshian vs Syrian In Labor Force | Age 35-44 Correlation Chart
The statistical analysis conducted on geographies consisting of 15,626,462 people shows a weak positive correlation between the proportion of Tsimshian and labor force participation rate among population between the ages 35 and 44 in the United States with a correlation coefficient (R) of 0.212 and weighted average of 83.5%. Similarly, the statistical analysis conducted on geographies consisting of 266,205,393 people shows a moderate positive correlation between the proportion of Syrians and labor force participation rate among population between the ages 35 and 44 in the United States with a correlation coefficient (R) of 0.424 and weighted average of 84.2%, a difference of 0.79%.
In Labor Force | Age 35-44 Correlation Summary
| Measurement | Tsimshian | Syrian |
| Minimum | 57.1% | 65.3% |
| Maximum | 100.0% | 100.0% |
| Range | 42.9% | 34.7% |
| Mean | 80.2% | 87.4% |
| Median | 83.6% | 85.0% |
| Interquartile 25% (IQ1) | 71.6% | 83.2% |
| Interquartile 75% (IQ3) | 86.8% | 95.7% |
| Interquartile Range (IQR) | 15.2% | 12.6% |
| Standard Deviation (Sample) | 11.9% | 8.0% |
| Standard Deviation (Population) | 11.5% | 8.0% |
Similar Demographics by In Labor Force | Age 35-44
Demographics Similar to Tsimshian by In Labor Force | Age 35-44
In terms of in labor force | age 35-44, the demographic groups most similar to Tsimshian are Basque (83.6%, a difference of 0.020%), Immigrants from El Salvador (83.5%, a difference of 0.020%), Vietnamese (83.5%, a difference of 0.030%), Japanese (83.6%, a difference of 0.040%), and Immigrants from Dominica (83.5%, a difference of 0.040%).
| Demographics | Rating | Rank | In Labor Force | Age 35-44 |
| Salvadorans | 0.4 /100 | #251 | Tragic 83.6% |
| Immigrants | Guyana | 0.4 /100 | #252 | Tragic 83.6% |
| Lebanese | 0.4 /100 | #253 | Tragic 83.6% |
| Tongans | 0.4 /100 | #254 | Tragic 83.6% |
| Immigrants | Azores | 0.3 /100 | #255 | Tragic 83.6% |
| Japanese | 0.3 /100 | #256 | Tragic 83.6% |
| Basques | 0.3 /100 | #257 | Tragic 83.6% |
| Tsimshian | 0.2 /100 | #258 | Tragic 83.5% |
| Immigrants | El Salvador | 0.2 /100 | #259 | Tragic 83.5% |
| Vietnamese | 0.2 /100 | #260 | Tragic 83.5% |
| Immigrants | Dominica | 0.2 /100 | #261 | Tragic 83.5% |
| Immigrants | Congo | 0.2 /100 | #262 | Tragic 83.5% |
| Iroquois | 0.2 /100 | #263 | Tragic 83.5% |
| Scotch-Irish | 0.1 /100 | #264 | Tragic 83.5% |
| Central Americans | 0.1 /100 | #265 | Tragic 83.5% |
Demographics Similar to Syrians by In Labor Force | Age 35-44
In terms of in labor force | age 35-44, the demographic groups most similar to Syrians are Moroccan (84.2%, a difference of 0.0%), British (84.2%, a difference of 0.0%), Immigrants from Uzbekistan (84.2%, a difference of 0.0%), Immigrants from Western Europe (84.2%, a difference of 0.010%), and Ecuadorian (84.2%, a difference of 0.010%).
| Demographics | Rating | Rank | In Labor Force | Age 35-44 |
| Immigrants | Vietnam | 27.4 /100 | #192 | Fair 84.2% |
| Hungarians | 26.8 /100 | #193 | Fair 84.2% |
| Immigrants | Indonesia | 25.7 /100 | #194 | Fair 84.2% |
| Immigrants | Caribbean | 25.7 /100 | #195 | Fair 84.2% |
| Immigrants | England | 25.0 /100 | #196 | Fair 84.2% |
| Immigrants | Western Europe | 24.7 /100 | #197 | Fair 84.2% |
| Ecuadorians | 24.0 /100 | #198 | Fair 84.2% |
| Syrians | 23.2 /100 | #199 | Fair 84.2% |
| Moroccans | 23.2 /100 | #200 | Fair 84.2% |
| British | 23.0 /100 | #201 | Fair 84.2% |
| Immigrants | Uzbekistan | 22.8 /100 | #202 | Fair 84.2% |
| Immigrants | South Eastern Asia | 22.4 /100 | #203 | Fair 84.2% |
| Canadians | 19.9 /100 | #204 | Poor 84.2% |
| Immigrants | Canada | 19.6 /100 | #205 | Poor 84.2% |
| Immigrants | Costa Rica | 19.5 /100 | #206 | Poor 84.2% |