Tongan vs Immigrants from Northern Africa In Labor Force | Age 20-64
COMPARE
Tongan
Immigrants from Northern Africa
In Labor Force | Age 20-64
In Labor Force | Age 20-64 Comparison
Tongans
Immigrants from Northern Africa
80.3%
IN LABOR FORCE | AGE 20-64
98.8/ 100
METRIC RATING
60th/ 347
METRIC RANK
80.3%
IN LABOR FORCE | AGE 20-64
99.0/ 100
METRIC RATING
56th/ 347
METRIC RANK
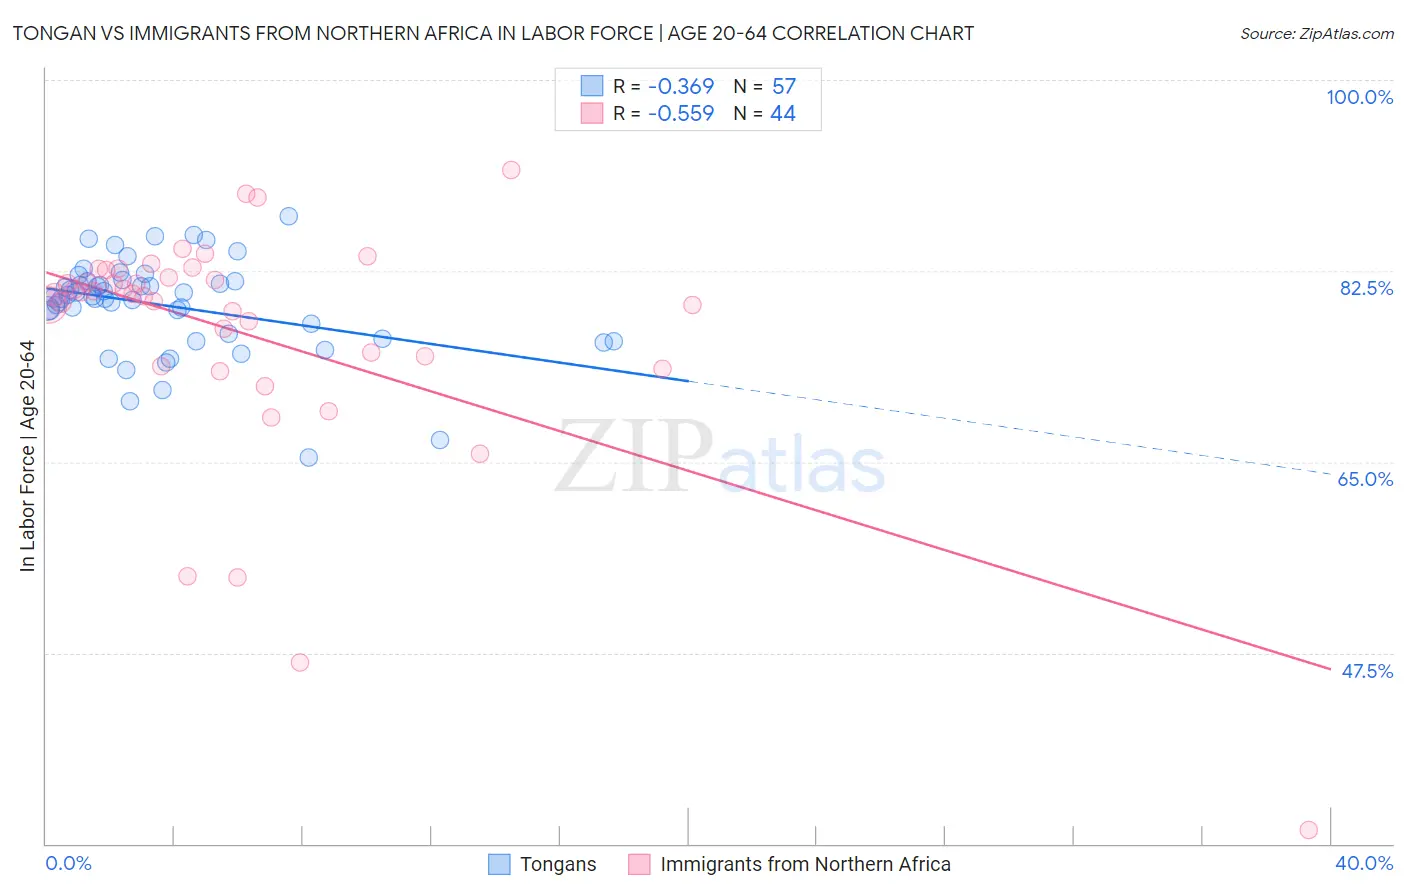
Tongan vs Immigrants from Northern Africa In Labor Force | Age 20-64 Correlation Chart
The statistical analysis conducted on geographies consisting of 102,905,644 people shows a mild negative correlation between the proportion of Tongans and labor force participation rate among population between the ages 20 and 64 in the United States with a correlation coefficient (R) of -0.369 and weighted average of 80.3%. Similarly, the statistical analysis conducted on geographies consisting of 321,204,498 people shows a substantial negative correlation between the proportion of Immigrants from Northern Africa and labor force participation rate among population between the ages 20 and 64 in the United States with a correlation coefficient (R) of -0.559 and weighted average of 80.3%, a difference of 0.020%.
In Labor Force | Age 20-64 Correlation Summary
| Measurement | Tongan | Immigrants from Northern Africa |
| Minimum | 65.4% | 31.3% |
| Maximum | 87.5% | 91.8% |
| Range | 22.1% | 60.5% |
| Mean | 79.3% | 76.7% |
| Median | 80.0% | 80.4% |
| Interquartile 25% (IQ1) | 76.5% | 74.2% |
| Interquartile 75% (IQ3) | 81.6% | 82.2% |
| Interquartile Range (IQR) | 5.0% | 8.0% |
| Standard Deviation (Sample) | 4.4% | 11.2% |
| Standard Deviation (Population) | 4.3% | 11.1% |
Demographics Similar to Tongans and Immigrants from Northern Africa by In Labor Force | Age 20-64
In terms of in labor force | age 20-64, the demographic groups most similar to Tongans are Swedish (80.3%, a difference of 0.0%), Burmese (80.3%, a difference of 0.0%), Carpatho Rusyn (80.3%, a difference of 0.0%), Serbian (80.3%, a difference of 0.010%), and Immigrants from Korea (80.3%, a difference of 0.010%). Similarly, the demographic groups most similar to Immigrants from Northern Africa are Afghan (80.3%, a difference of 0.0%), Immigrants from Cabo Verde (80.3%, a difference of 0.010%), Serbian (80.3%, a difference of 0.010%), Swedish (80.3%, a difference of 0.020%), and Burmese (80.3%, a difference of 0.020%).
| Demographics | Rating | Rank | In Labor Force | Age 20-64 |
| Immigrants | Hong Kong | 99.5 /100 | #48 | Exceptional 80.4% |
| Immigrants | Greece | 99.4 /100 | #49 | Exceptional 80.4% |
| Immigrants | Sudan | 99.4 /100 | #50 | Exceptional 80.4% |
| Immigrants | Sri Lanka | 99.3 /100 | #51 | Exceptional 80.4% |
| Turks | 99.2 /100 | #52 | Exceptional 80.3% |
| Immigrants | Peru | 99.2 /100 | #53 | Exceptional 80.3% |
| Peruvians | 99.1 /100 | #54 | Exceptional 80.3% |
| Immigrants | Cabo Verde | 99.0 /100 | #55 | Exceptional 80.3% |
| Immigrants | Northern Africa | 99.0 /100 | #56 | Exceptional 80.3% |
| Afghans | 98.9 /100 | #57 | Exceptional 80.3% |
| Serbians | 98.9 /100 | #58 | Exceptional 80.3% |
| Swedes | 98.9 /100 | #59 | Exceptional 80.3% |
| Tongans | 98.8 /100 | #60 | Exceptional 80.3% |
| Burmese | 98.8 /100 | #61 | Exceptional 80.3% |
| Carpatho Rusyns | 98.8 /100 | #62 | Exceptional 80.3% |
| Immigrants | Korea | 98.8 /100 | #63 | Exceptional 80.3% |
| Immigrants | Albania | 98.7 /100 | #64 | Exceptional 80.3% |
| Lithuanians | 98.7 /100 | #65 | Exceptional 80.2% |
| Macedonians | 98.7 /100 | #66 | Exceptional 80.2% |
| Taiwanese | 98.6 /100 | #67 | Exceptional 80.2% |
| Bhutanese | 98.6 /100 | #68 | Exceptional 80.2% |