Tohono O'odham vs Irish In Labor Force | Age 16-19
COMPARE
Tohono O'odham
Irish
In Labor Force | Age 16-19
In Labor Force | Age 16-19 Comparison
Tohono O'odham
Irish
31.3%
IN LABOR FORCE | AGE 16-19
0.0/ 100
METRIC RATING
322nd/ 347
METRIC RANK
42.0%
IN LABOR FORCE | AGE 16-19
100.0/ 100
METRIC RATING
31st/ 347
METRIC RANK
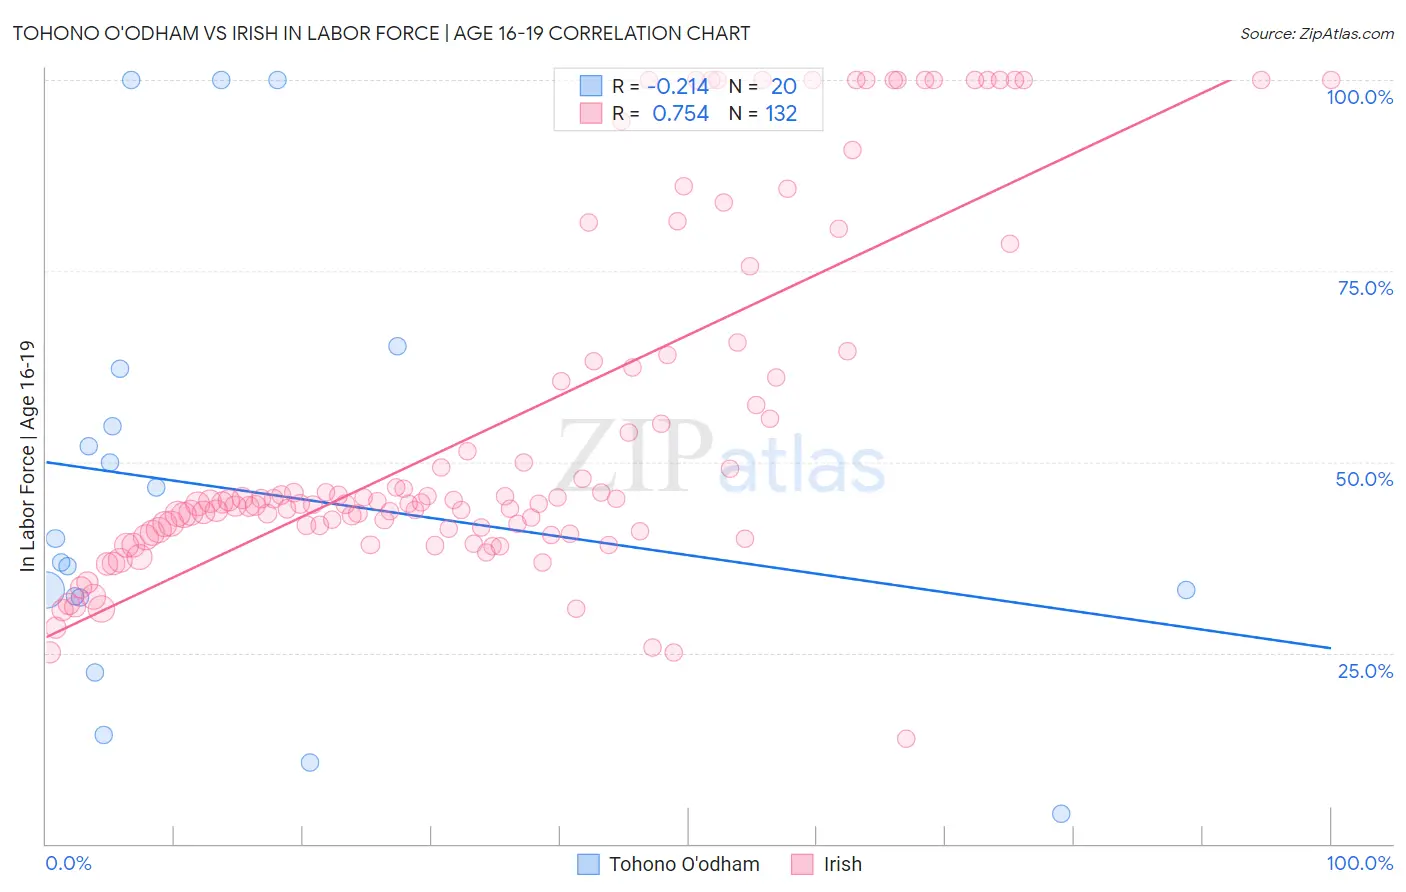
Tohono O'odham vs Irish In Labor Force | Age 16-19 Correlation Chart
The statistical analysis conducted on geographies consisting of 58,700,142 people shows a weak negative correlation between the proportion of Tohono O'odham and labor force participation rate among population between the ages 16 and 19 in the United States with a correlation coefficient (R) of -0.214 and weighted average of 31.3%. Similarly, the statistical analysis conducted on geographies consisting of 574,711,118 people shows a strong positive correlation between the proportion of Irish and labor force participation rate among population between the ages 16 and 19 in the United States with a correlation coefficient (R) of 0.754 and weighted average of 42.0%, a difference of 34.1%.
In Labor Force | Age 16-19 Correlation Summary
| Measurement | Tohono O'odham | Irish |
| Minimum | 4.0% | 13.8% |
| Maximum | 100.0% | 100.0% |
| Range | 96.0% | 86.2% |
| Mean | 46.3% | 54.4% |
| Median | 38.3% | 44.6% |
| Interquartile 25% (IQ1) | 32.4% | 41.0% |
| Interquartile 75% (IQ3) | 58.5% | 62.8% |
| Interquartile Range (IQR) | 26.1% | 21.8% |
| Standard Deviation (Sample) | 28.1% | 22.9% |
| Standard Deviation (Population) | 27.4% | 22.8% |
Similar Demographics by In Labor Force | Age 16-19
Demographics Similar to Tohono O'odham by In Labor Force | Age 16-19
In terms of in labor force | age 16-19, the demographic groups most similar to Tohono O'odham are West Indian (31.3%, a difference of 0.12%), Immigrants from Caribbean (31.2%, a difference of 0.13%), Dominican (31.2%, a difference of 0.31%), Ecuadorian (31.4%, a difference of 0.35%), and Soviet Union (31.4%, a difference of 0.41%).
| Demographics | Rating | Rank | In Labor Force | Age 16-19 |
| Immigrants | West Indies | 0.0 /100 | #315 | Tragic 31.7% |
| Filipinos | 0.0 /100 | #316 | Tragic 31.7% |
| Immigrants | Nicaragua | 0.0 /100 | #317 | Tragic 31.6% |
| Immigrants | Yemen | 0.0 /100 | #318 | Tragic 31.5% |
| Soviet Union | 0.0 /100 | #319 | Tragic 31.4% |
| Ecuadorians | 0.0 /100 | #320 | Tragic 31.4% |
| West Indians | 0.0 /100 | #321 | Tragic 31.3% |
| Tohono O'odham | 0.0 /100 | #322 | Tragic 31.3% |
| Immigrants | Caribbean | 0.0 /100 | #323 | Tragic 31.2% |
| Dominicans | 0.0 /100 | #324 | Tragic 31.2% |
| Immigrants | China | 0.0 /100 | #325 | Tragic 31.1% |
| Immigrants | Dominican Republic | 0.0 /100 | #326 | Tragic 31.1% |
| Immigrants | Taiwan | 0.0 /100 | #327 | Tragic 31.0% |
| Immigrants | Ecuador | 0.0 /100 | #328 | Tragic 31.0% |
| Barbadians | 0.0 /100 | #329 | Tragic 31.0% |
Demographics Similar to Irish by In Labor Force | Age 16-19
In terms of in labor force | age 16-19, the demographic groups most similar to Irish are Scottish (42.0%, a difference of 0.070%), Czechoslovakian (41.9%, a difference of 0.20%), Liberian (41.8%, a difference of 0.34%), French (42.1%, a difference of 0.35%), and Polish (42.1%, a difference of 0.40%).
| Demographics | Rating | Rank | In Labor Force | Age 16-19 |
| Bangladeshis | 100.0 /100 | #24 | Exceptional 42.5% |
| German Russians | 100.0 /100 | #25 | Exceptional 42.4% |
| English | 100.0 /100 | #26 | Exceptional 42.4% |
| Welsh | 100.0 /100 | #27 | Exceptional 42.3% |
| Poles | 100.0 /100 | #28 | Exceptional 42.1% |
| French | 100.0 /100 | #29 | Exceptional 42.1% |
| Scottish | 100.0 /100 | #30 | Exceptional 42.0% |
| Irish | 100.0 /100 | #31 | Exceptional 42.0% |
| Czechoslovakians | 100.0 /100 | #32 | Exceptional 41.9% |
| Liberians | 100.0 /100 | #33 | Exceptional 41.8% |
| Immigrants | Bosnia and Herzegovina | 100.0 /100 | #34 | Exceptional 41.8% |
| Yugoslavians | 100.0 /100 | #35 | Exceptional 41.8% |
| Immigrants | Azores | 100.0 /100 | #36 | Exceptional 41.7% |
| Immigrants | Congo | 100.0 /100 | #37 | Exceptional 41.7% |
| Sioux | 100.0 /100 | #38 | Exceptional 41.5% |