Immigrants from Ukraine vs Irish In Labor Force | Age 16-19
COMPARE
Immigrants from Ukraine
Irish
In Labor Force | Age 16-19
In Labor Force | Age 16-19 Comparison
Immigrants from Ukraine
Irish
34.8%
IN LABOR FORCE | AGE 16-19
2.2/ 100
METRIC RATING
249th/ 347
METRIC RANK
42.0%
IN LABOR FORCE | AGE 16-19
100.0/ 100
METRIC RATING
31st/ 347
METRIC RANK
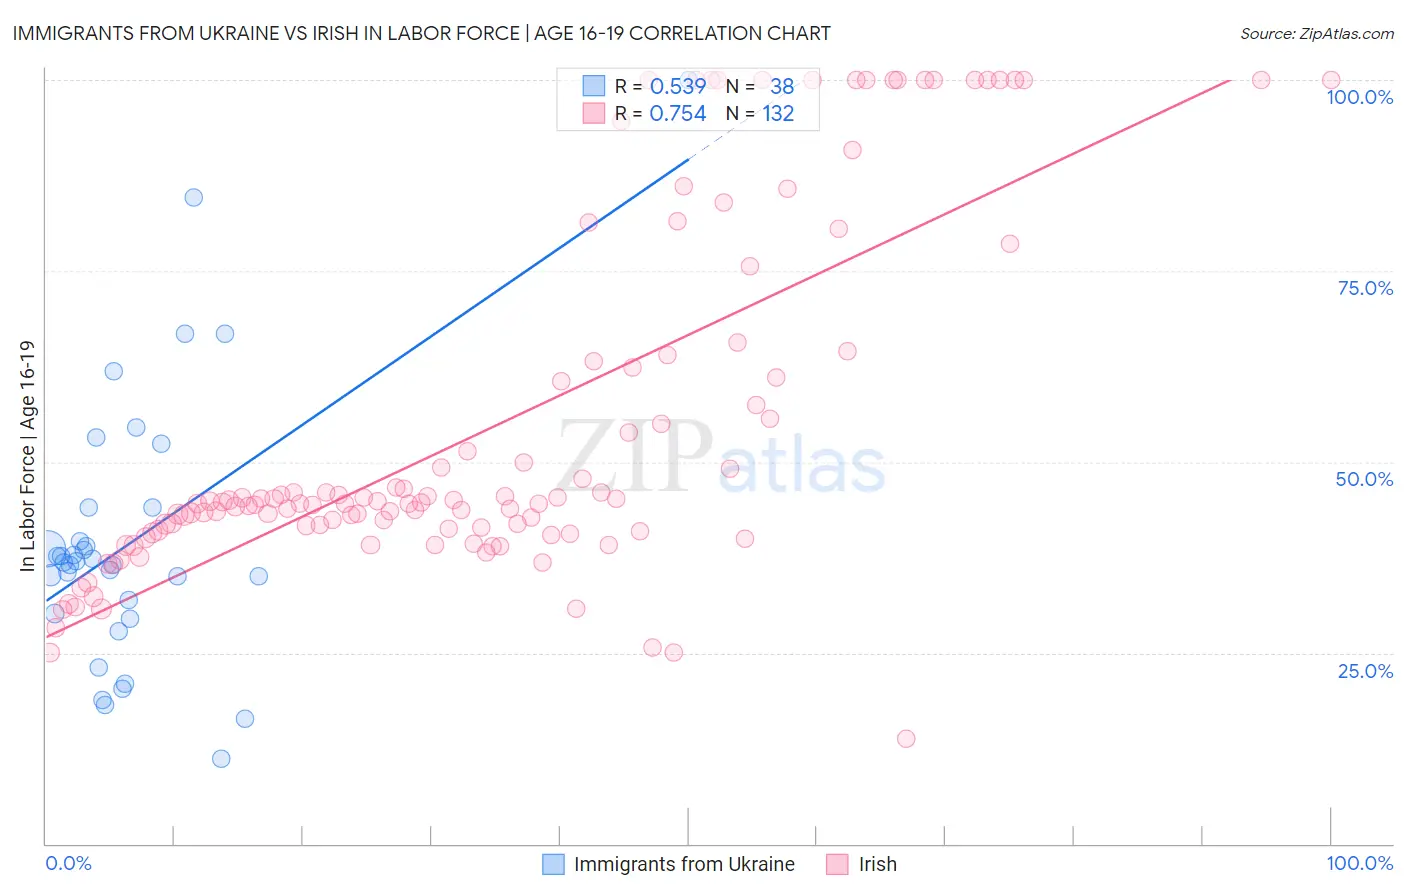
Immigrants from Ukraine vs Irish In Labor Force | Age 16-19 Correlation Chart
The statistical analysis conducted on geographies consisting of 289,313,664 people shows a substantial positive correlation between the proportion of Immigrants from Ukraine and labor force participation rate among population between the ages 16 and 19 in the United States with a correlation coefficient (R) of 0.539 and weighted average of 34.8%. Similarly, the statistical analysis conducted on geographies consisting of 574,711,118 people shows a strong positive correlation between the proportion of Irish and labor force participation rate among population between the ages 16 and 19 in the United States with a correlation coefficient (R) of 0.754 and weighted average of 42.0%, a difference of 20.5%.
In Labor Force | Age 16-19 Correlation Summary
| Measurement | Immigrants from Ukraine | Irish |
| Minimum | 11.2% | 13.8% |
| Maximum | 100.0% | 100.0% |
| Range | 88.8% | 86.2% |
| Mean | 39.6% | 54.4% |
| Median | 36.9% | 44.6% |
| Interquartile 25% (IQ1) | 30.1% | 41.0% |
| Interquartile 75% (IQ3) | 44.0% | 62.8% |
| Interquartile Range (IQR) | 13.9% | 21.8% |
| Standard Deviation (Sample) | 18.0% | 22.9% |
| Standard Deviation (Population) | 17.8% | 22.8% |
Similar Demographics by In Labor Force | Age 16-19
Demographics Similar to Immigrants from Ukraine by In Labor Force | Age 16-19
In terms of in labor force | age 16-19, the demographic groups most similar to Immigrants from Ukraine are Central American (34.8%, a difference of 0.030%), Immigrants from Pakistan (34.8%, a difference of 0.10%), Immigrants from Sri Lanka (34.9%, a difference of 0.12%), Laotian (34.9%, a difference of 0.12%), and Immigrants from Western Asia (34.8%, a difference of 0.12%).
| Demographics | Rating | Rank | In Labor Force | Age 16-19 |
| Uruguayans | 2.6 /100 | #242 | Tragic 34.9% |
| Pueblo | 2.6 /100 | #243 | Tragic 34.9% |
| Immigrants | Turkey | 2.6 /100 | #244 | Tragic 34.9% |
| Immigrants | Greece | 2.4 /100 | #245 | Tragic 34.9% |
| Immigrants | Sri Lanka | 2.4 /100 | #246 | Tragic 34.9% |
| Laotians | 2.4 /100 | #247 | Tragic 34.9% |
| Central Americans | 2.2 /100 | #248 | Tragic 34.8% |
| Immigrants | Ukraine | 2.2 /100 | #249 | Tragic 34.8% |
| Immigrants | Pakistan | 2.0 /100 | #250 | Tragic 34.8% |
| Immigrants | Western Asia | 2.0 /100 | #251 | Tragic 34.8% |
| Immigrants | Chile | 2.0 /100 | #252 | Tragic 34.8% |
| Immigrants | Japan | 1.5 /100 | #253 | Tragic 34.7% |
| Bahamians | 1.4 /100 | #254 | Tragic 34.6% |
| Peruvians | 1.4 /100 | #255 | Tragic 34.6% |
| Immigrants | South Central Asia | 1.3 /100 | #256 | Tragic 34.6% |
Demographics Similar to Irish by In Labor Force | Age 16-19
In terms of in labor force | age 16-19, the demographic groups most similar to Irish are Scottish (42.0%, a difference of 0.070%), Czechoslovakian (41.9%, a difference of 0.20%), Liberian (41.8%, a difference of 0.34%), French (42.1%, a difference of 0.35%), and Polish (42.1%, a difference of 0.40%).
| Demographics | Rating | Rank | In Labor Force | Age 16-19 |
| Bangladeshis | 100.0 /100 | #24 | Exceptional 42.5% |
| German Russians | 100.0 /100 | #25 | Exceptional 42.4% |
| English | 100.0 /100 | #26 | Exceptional 42.4% |
| Welsh | 100.0 /100 | #27 | Exceptional 42.3% |
| Poles | 100.0 /100 | #28 | Exceptional 42.1% |
| French | 100.0 /100 | #29 | Exceptional 42.1% |
| Scottish | 100.0 /100 | #30 | Exceptional 42.0% |
| Irish | 100.0 /100 | #31 | Exceptional 42.0% |
| Czechoslovakians | 100.0 /100 | #32 | Exceptional 41.9% |
| Liberians | 100.0 /100 | #33 | Exceptional 41.8% |
| Immigrants | Bosnia and Herzegovina | 100.0 /100 | #34 | Exceptional 41.8% |
| Yugoslavians | 100.0 /100 | #35 | Exceptional 41.8% |
| Immigrants | Azores | 100.0 /100 | #36 | Exceptional 41.7% |
| Immigrants | Congo | 100.0 /100 | #37 | Exceptional 41.7% |
| Sioux | 100.0 /100 | #38 | Exceptional 41.5% |