Burmese vs Irish In Labor Force | Age 16-19
COMPARE
Burmese
Irish
In Labor Force | Age 16-19
In Labor Force | Age 16-19 Comparison
Burmese
Irish
34.5%
IN LABOR FORCE | AGE 16-19
1.1/ 100
METRIC RATING
263rd/ 347
METRIC RANK
42.0%
IN LABOR FORCE | AGE 16-19
100.0/ 100
METRIC RATING
31st/ 347
METRIC RANK
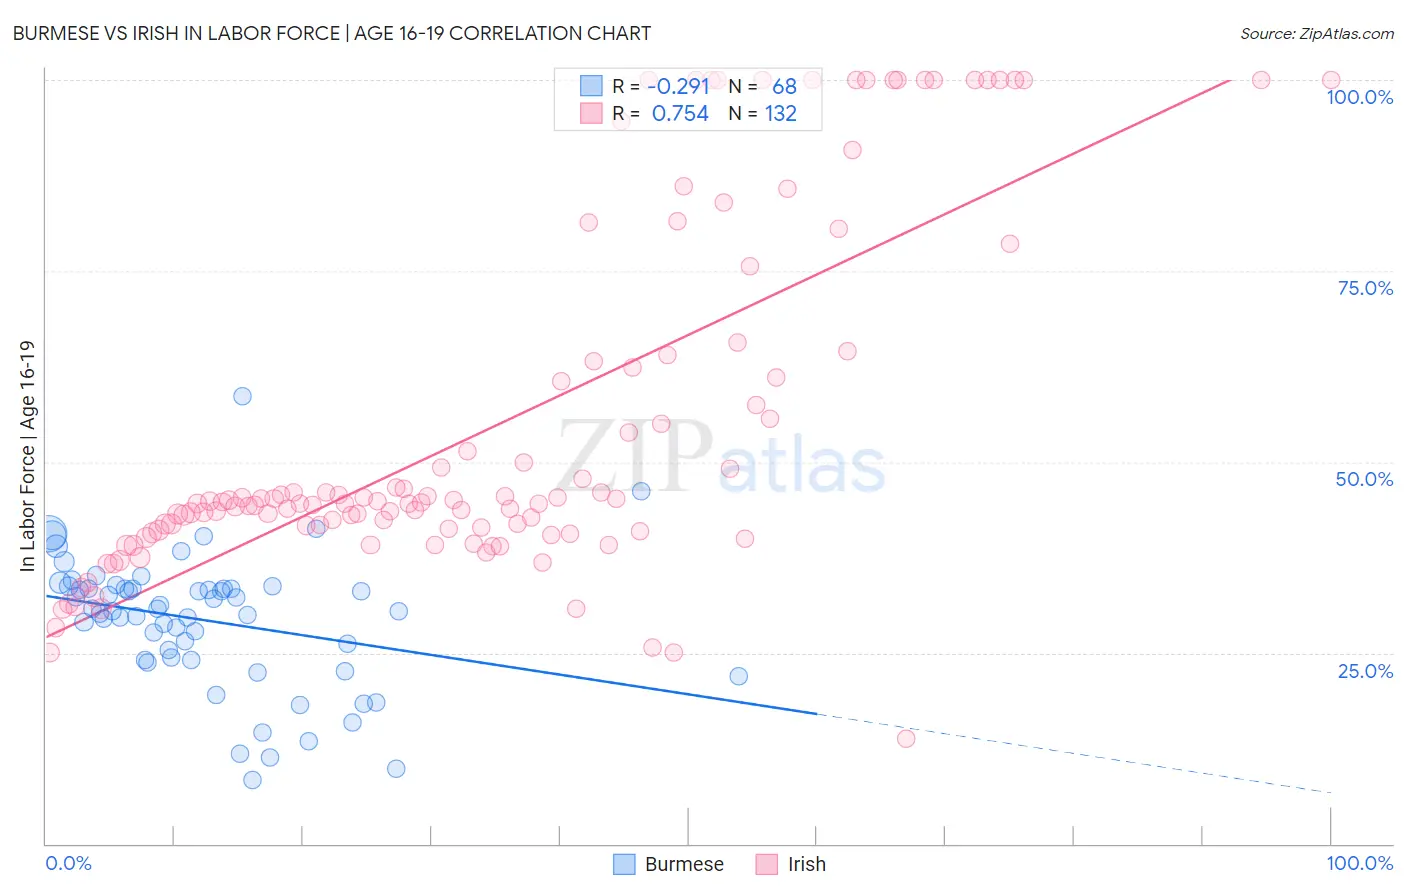
Burmese vs Irish In Labor Force | Age 16-19 Correlation Chart
The statistical analysis conducted on geographies consisting of 464,488,872 people shows a weak negative correlation between the proportion of Burmese and labor force participation rate among population between the ages 16 and 19 in the United States with a correlation coefficient (R) of -0.291 and weighted average of 34.5%. Similarly, the statistical analysis conducted on geographies consisting of 574,711,118 people shows a strong positive correlation between the proportion of Irish and labor force participation rate among population between the ages 16 and 19 in the United States with a correlation coefficient (R) of 0.754 and weighted average of 42.0%, a difference of 21.7%.
In Labor Force | Age 16-19 Correlation Summary
| Measurement | Burmese | Irish |
| Minimum | 8.3% | 13.8% |
| Maximum | 58.6% | 100.0% |
| Range | 50.3% | 86.2% |
| Mean | 29.3% | 54.4% |
| Median | 30.7% | 44.6% |
| Interquartile 25% (IQ1) | 24.3% | 41.0% |
| Interquartile 75% (IQ3) | 33.4% | 62.8% |
| Interquartile Range (IQR) | 9.2% | 21.8% |
| Standard Deviation (Sample) | 8.8% | 22.9% |
| Standard Deviation (Population) | 8.7% | 22.8% |
Similar Demographics by In Labor Force | Age 16-19
Demographics Similar to Burmese by In Labor Force | Age 16-19
In terms of in labor force | age 16-19, the demographic groups most similar to Burmese are Hispanic or Latino (34.5%, a difference of 0.040%), Salvadoran (34.5%, a difference of 0.050%), Egyptian (34.5%, a difference of 0.090%), Immigrants (34.6%, a difference of 0.17%), and Immigrants from Egypt (34.6%, a difference of 0.19%).
| Demographics | Rating | Rank | In Labor Force | Age 16-19 |
| Immigrants | South Central Asia | 1.3 /100 | #256 | Tragic 34.6% |
| Immigrants | Egypt | 1.2 /100 | #257 | Tragic 34.6% |
| Thais | 1.2 /100 | #258 | Tragic 34.6% |
| Immigrants | Immigrants | 1.2 /100 | #259 | Tragic 34.6% |
| Egyptians | 1.2 /100 | #260 | Tragic 34.5% |
| Salvadorans | 1.1 /100 | #261 | Tragic 34.5% |
| Hispanics or Latinos | 1.1 /100 | #262 | Tragic 34.5% |
| Burmese | 1.1 /100 | #263 | Tragic 34.5% |
| Immigrants | Uruguay | 0.9 /100 | #264 | Tragic 34.4% |
| Immigrants | El Salvador | 0.7 /100 | #265 | Tragic 34.3% |
| Immigrants | Malaysia | 0.7 /100 | #266 | Tragic 34.3% |
| Immigrants | Peru | 0.5 /100 | #267 | Tragic 34.2% |
| Immigrants | Asia | 0.5 /100 | #268 | Tragic 34.1% |
| Pima | 0.5 /100 | #269 | Tragic 34.1% |
| Immigrants | Russia | 0.4 /100 | #270 | Tragic 34.1% |
Demographics Similar to Irish by In Labor Force | Age 16-19
In terms of in labor force | age 16-19, the demographic groups most similar to Irish are Scottish (42.0%, a difference of 0.070%), Czechoslovakian (41.9%, a difference of 0.20%), Liberian (41.8%, a difference of 0.34%), French (42.1%, a difference of 0.35%), and Polish (42.1%, a difference of 0.40%).
| Demographics | Rating | Rank | In Labor Force | Age 16-19 |
| Bangladeshis | 100.0 /100 | #24 | Exceptional 42.5% |
| German Russians | 100.0 /100 | #25 | Exceptional 42.4% |
| English | 100.0 /100 | #26 | Exceptional 42.4% |
| Welsh | 100.0 /100 | #27 | Exceptional 42.3% |
| Poles | 100.0 /100 | #28 | Exceptional 42.1% |
| French | 100.0 /100 | #29 | Exceptional 42.1% |
| Scottish | 100.0 /100 | #30 | Exceptional 42.0% |
| Irish | 100.0 /100 | #31 | Exceptional 42.0% |
| Czechoslovakians | 100.0 /100 | #32 | Exceptional 41.9% |
| Liberians | 100.0 /100 | #33 | Exceptional 41.8% |
| Immigrants | Bosnia and Herzegovina | 100.0 /100 | #34 | Exceptional 41.8% |
| Yugoslavians | 100.0 /100 | #35 | Exceptional 41.8% |
| Immigrants | Azores | 100.0 /100 | #36 | Exceptional 41.7% |
| Immigrants | Congo | 100.0 /100 | #37 | Exceptional 41.7% |
| Sioux | 100.0 /100 | #38 | Exceptional 41.5% |